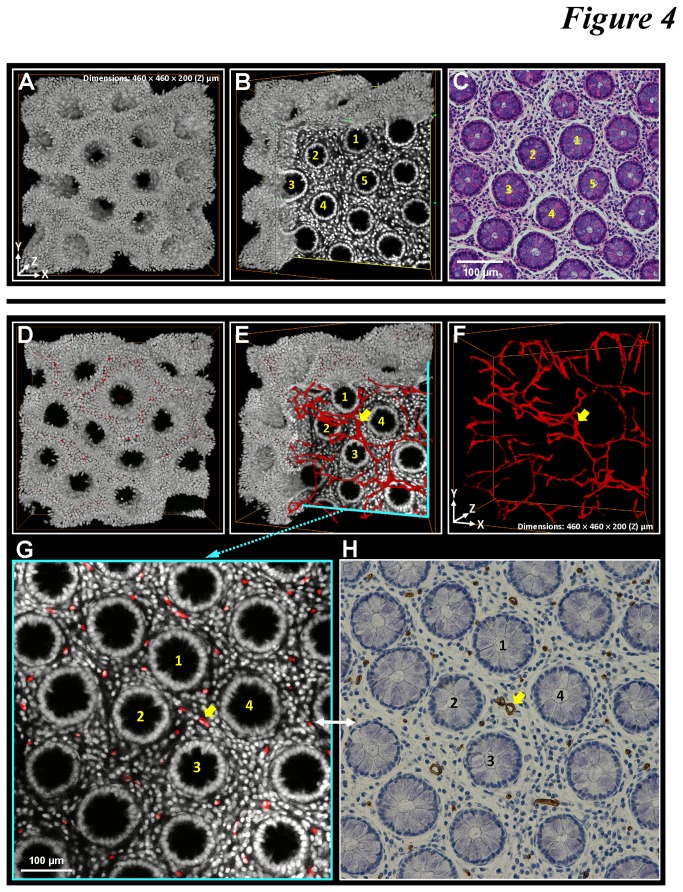
Figure 4. Matched tissue information derived from 3-D and 2-D histology.
(A-C) Matched crypt morphology in micrographs derived from 3-D microscopy and H&E staining. Panels A and B: 3-D projections of the nuclear signals and one of the images derived from the confocal image stack. Panel C: H&E image of the same specimen used in (A) and (B). The yellow numbers in (B) and (C) indicate the same crypts found in the 3-D and 2-D images. (D-F) 3-D projection of the mucosal microstructure and vasculature. Panel D: merged projection of the nuclear (gray) and CD34 (red) signals. In panel E, the nuclear signals were digitally removed at a corner to reveal the embedded vasculature. Panel F: projection of the CD34 signals. (G and H) Counterparts of mucosal microstructure and vasculature revealed in 3-D and 2-D histology. Panel G: enlarged micrograph derived from the confocal image stack shown in panel E. Panel H: image derived from the standard CD34 immunostaining of the same specimen used in panels D-F (the specimen was retrieved after 3-D microscopy to perform standard histology). The numbers and arrows in panels E-H indicate the same crypts and microvessel.

