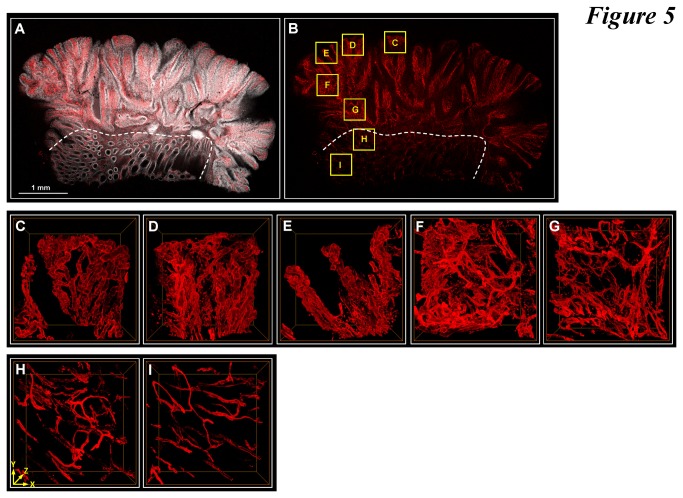
Figure 5. 3-D imaging and illustration of microvessels in adenocarcinoma.
(A and B) Tissue map of tumor specimen. Gray: nuclei. Red: CD34. Six images were stitched (derived from the tile scanning mode of confocal microscopy) to provide a gross view of the tissue structure across the adenocarcinoma and the apparent normal domain (the dotted line indicates the boundary). Seven regions of the tissue were marked for zoom-in investigation (boxes C-I). (C-G) 3-D projection of microvessels in adenocarcinoma. Panels C-G are the zoom-in examination of boxes C-G in panel B. In these regions, the microvessels are dilated and tortuous with extensive branches in comparison with the capillaries around the normal crypts (Figure 3F) and those in panels H and I. (H and I) 3-D projection of microvessels in the apparent normal region (controls, boxes H and I in panel B). Dimensions of each image stack: 460 (X) × 460 (Y) × 200 (Z, depth) μm.

