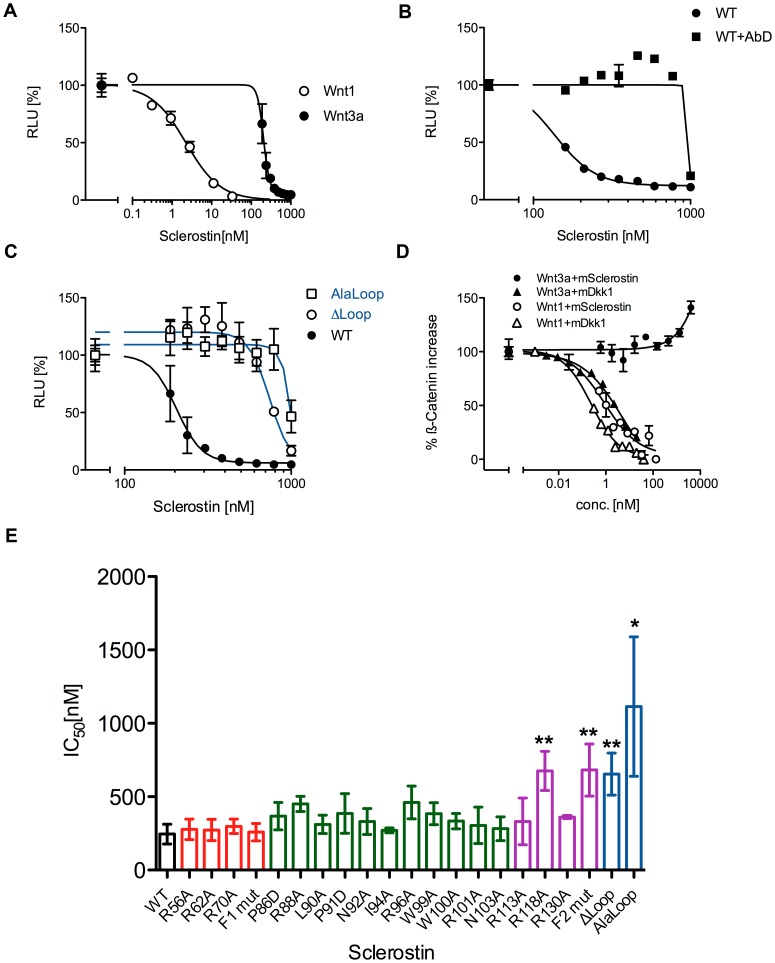
Figure 3. Inhibition of Wnt3a signaling by Sclerostin.
(A) HEK293TSA cells stably transfected with the Wnt-responsible luciferase reporter construct SuperTOPFlash were stimulated with 1.5 nM recombinant murine Wnt3a and serial dilutions of murine Sclerostin. Shown is the resulting dose response curve in comparison to the dose response curve of mWnt1-transfected cells as shown in figure 3. (B) mWnt3a-derived luciferase signal obtained in presence of Sclerostin wildtype (WT) and 2 µM Sclerostin specific antibody AbD09097 (AbD) or with WT alone. (C) Reporter gene assay as depicted in (A) and (B) showing the dose-dependency of Sclerostin Alaloop and ΔLoop in comparison to WT Sclerostin. Measurements were done in duplicate. (D) Measurement of the intracellular level of β-Catenin upon mWnt3a and mWnt1 stimulation in presence of Sclerostin or Dkk1 using In-Cell Western. The fluorescence signal determined from the antibody against β-Catenin was normalized for cell number using DNA staining with DRAQ5. Signal of non-transfected/untreated cells was set to 0% and signal of cells treated/transfected with Wnt proteins alone was set to 100%. A typical experiment out of three is shown; datapoints represent means with SD of two independent measurements. (E) Overview of the efficiency of Sclerostin WT and mutant proteins to neutralize Wnt3a driven luciferase expression (IC50 values represented as bar diagram). Data represent means with standard deviation (SD) of at least two independent experiments. *: P<0.05 **: P<0.01 (student's t-test with data obtained for wildtype Sclerostin). To highlight the location of the mutation in the Sclerostin structure the same color-coding as in figure 2 is used.

