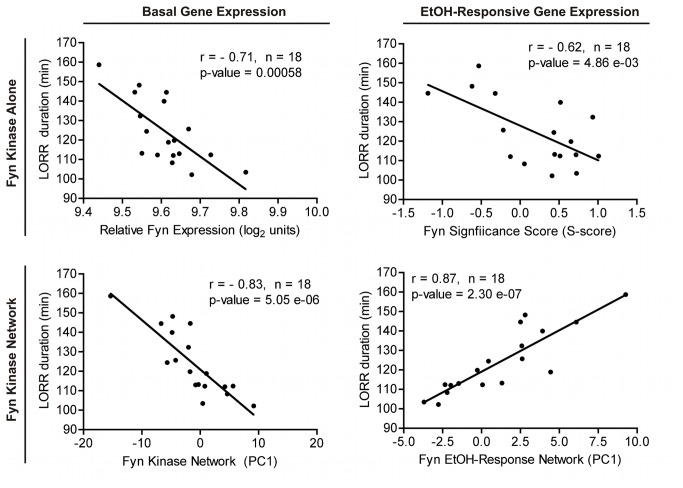
Figure 5. In silico correlation analysis of Fyn, Fyn gene networks and LORR behavior.
Pearson product moment correlations analysis of basal saline (RMA) gene expression (right panels) and ethanol-responsive (S-score) expression (left panels) versus ethanol LORR behavior (Rodriguez et al., 1995; WebQTL Record ID: 10589). Expression for Fyn (upper panels) or Fyn-dependent networks (lower panels) from Figure 4B and 4C are plotted versus LORR. For Fyn-dependent networks, the first principal component (PC1) for expression of all genes in the network was used for correlations with LORR. PC1 values are relative and do not indicate overall positive or negative correlations with LORR.

