
Figure 3. Aggregation studies.
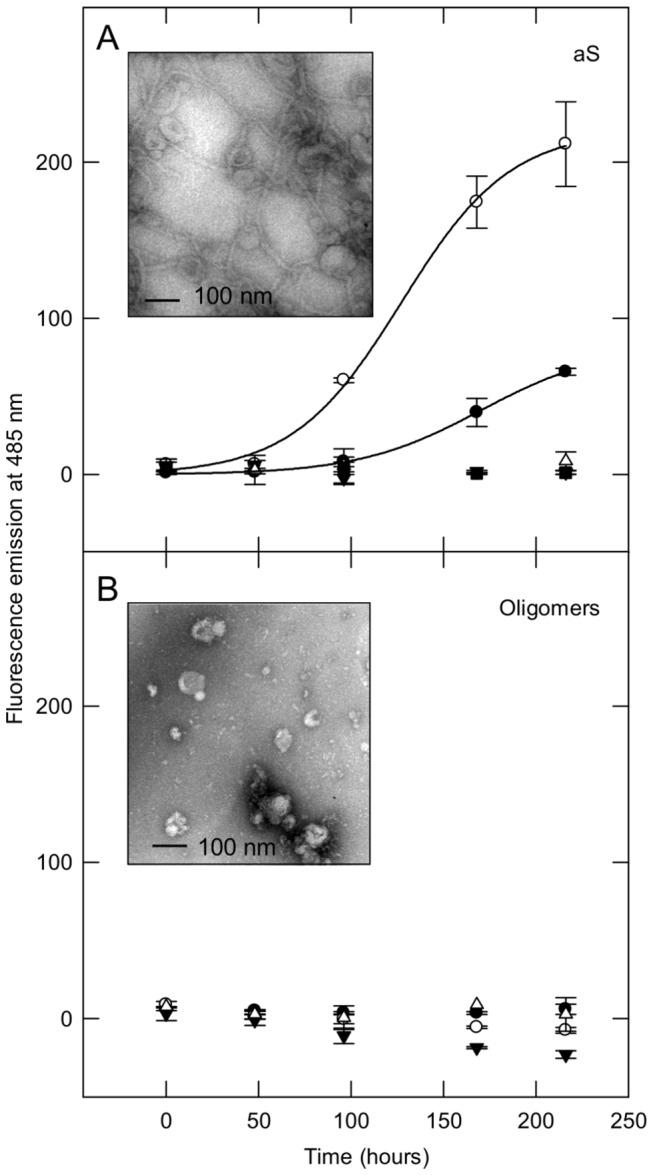
aS (A) and aS/DHA oligomers (B) aggregation process at 37°C in the presence of lipids, followed by ThT binding assay. aS or aS oligomers were dissolved in 20 mM Tris, 150 mM NaCl pH 7.4 at a 50 µM concentration in order to induce aggregation, in the absence (black circles) and in the presence of DOPG SUV, at molar ratio 1:20 (empty circles), 1:50 (empty triangles) and in the presence of DHA (molar ratio 1:50, inverted black triangles). The excitation wavelength was fixed at 440 nm, and the fluorescence emission was collected at 485 nm. To better visualize the aggregation trend of aS and aS in the presence of DOPG (molar ratio 1:20), the data points are fitted with a sigmoidal equation (SigmaPlot software). Inset: TEM images of protein material relative to aS and aS/DHA oligomers samples after 9 days of incubation in the presence of DOPG SUV (molar ratio 1:20).