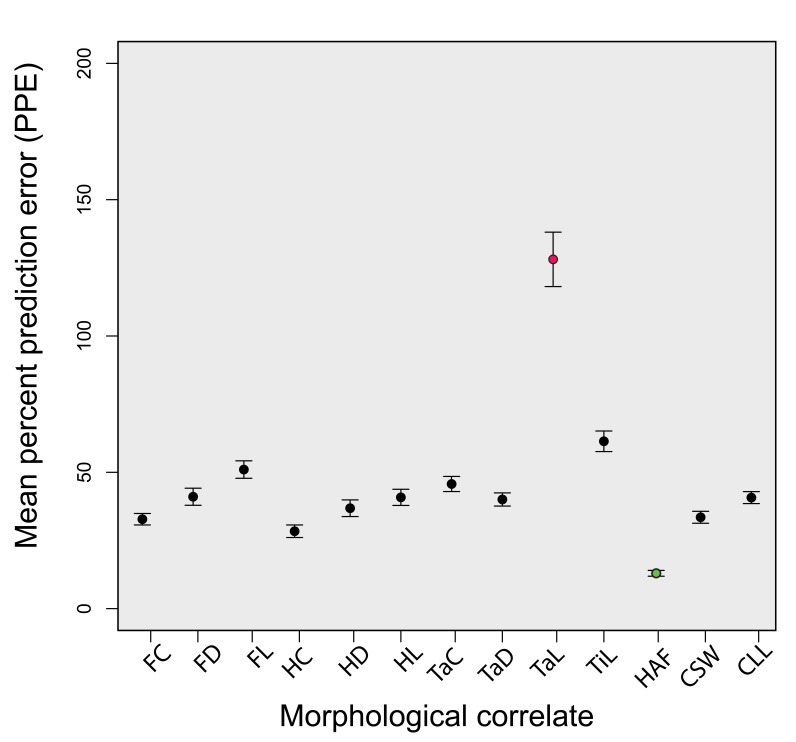
Figure 3. Comparison of the predictive power of several body mass proxies based on their mean percent prediction error (PPE).
Mean PPE for each correlate is represented by a circle, with 95% confidence intervals in black. The least precise correlate as reckoned by PPE (tarsometatarsus length) is shown in red, while the most precise (coracoid HAF length) is shown in green.

