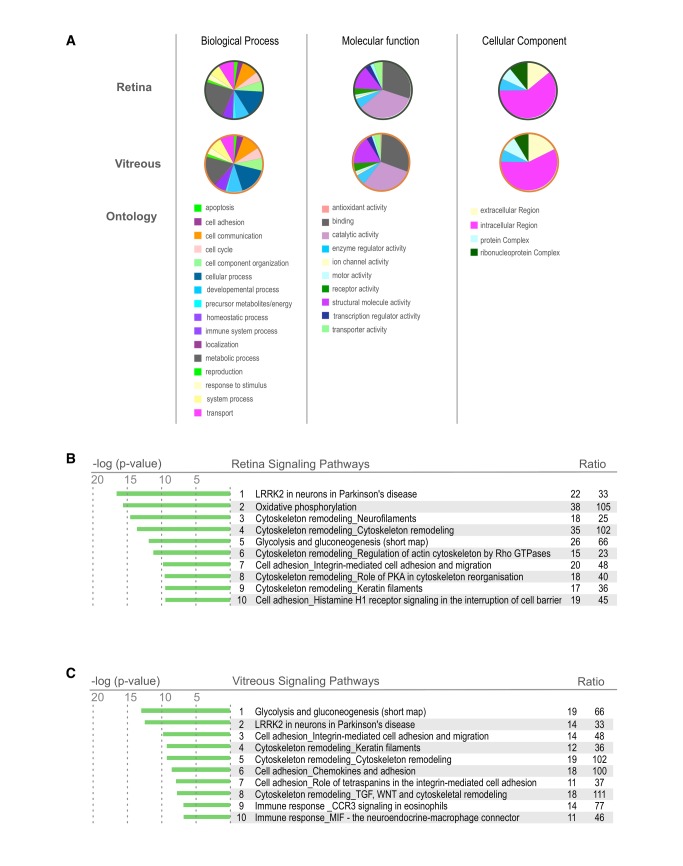
Figure 3. Retina and Vitreous Proteome Ontology.
A. Heatmap showing the differentially expressed proteins of the mouse vitreous and retina. There is a large population of proteins that are overexpressed in the retina in comparison to the vitreous. Proteins that are found in this heatmap provide an excellent reference for potential disease markers. Proteins that change their expression in these tissues could be used as potential biomarkers in the future. B. Gene Ontology distribution of proteins differentially expressed in the mouse vitreous and retina. Proteins are grouped into sub-categories of (A.) biological processes, (B.) cellular component, and (C.) molecular processes. C. List of pathways most highly represented in the mouse retina and vitreous tissues. These pathways were identified using GeneGO analysis software. (statistic). .

