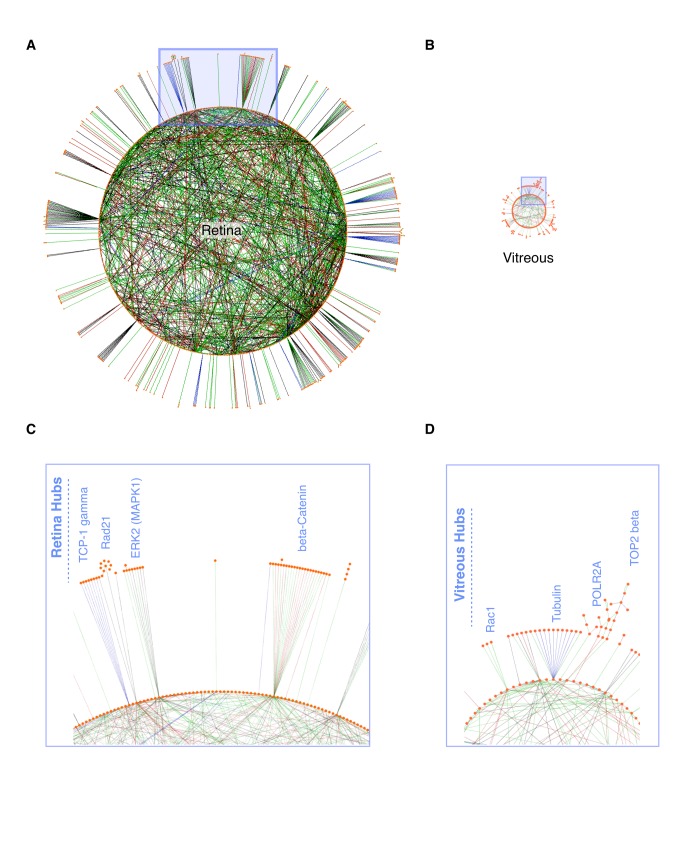
Figure 6. Mouse retina and vitreous protein networks.
A-B. Circular layout of the mouse retina and vitreous networks. Nodes (individual proteins; orange filled circles) with no edges (interactions) were not visualized. Nodes in the vitreous and retina are sized to the same scale to emphasize the difference in complexities of the two tissues. Enlarged blue box regions showing examples of hubs from the retina (C) and vitreous (D). Edges denote interactions (binding, substrate, transcriptional target) and are color coded (green = activation; red = inhibition; black = unknown).

