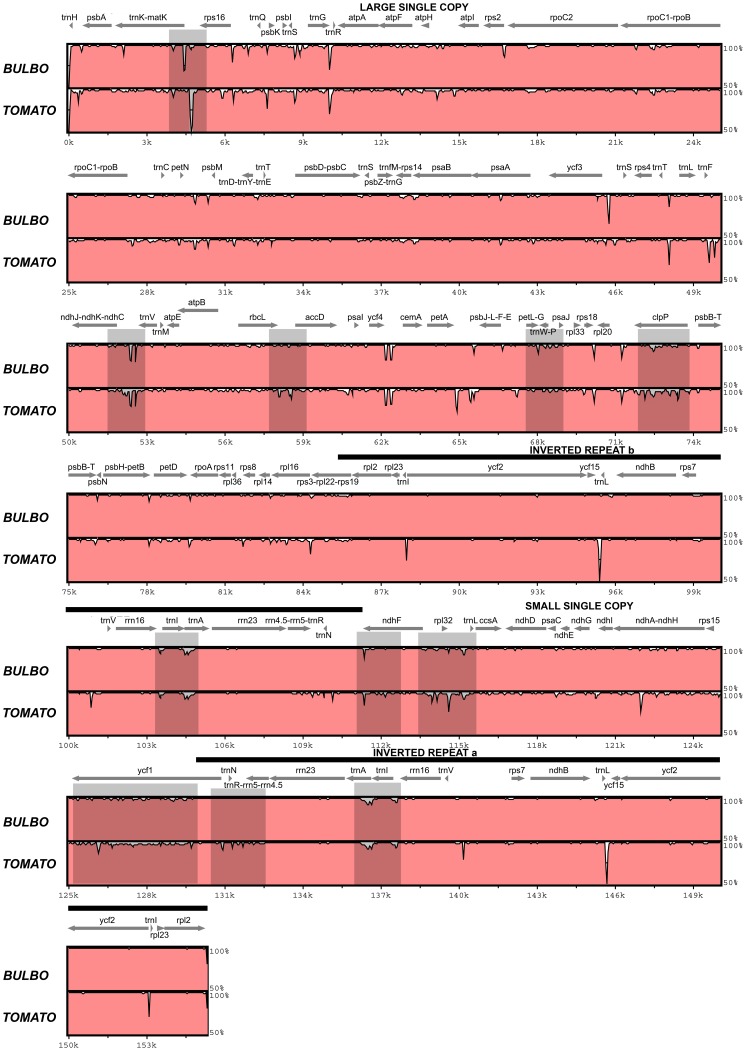
Figure 1. Sequence variation across the Solanum full plastome sequences.
Sequence variation across the three full plastid genomes of Solanum (S. tuberosum, S. bulbocastanum, and S. lycopersicum). The graph shows sequence similarity (%, shown in pale red) in relation to the reference sequence of S. tuberosum which was used to annotate the alignment. Grey arrows above the alignment indicate genes and their orientation. Thick black lines show the position of the Inverted Repeat (IR) regions. The most variable regions detected based on a sliding window analysis are highlighted in grey. BULBO = S. bulbocastanum, TOMATO (S. lycopersicum).

