
Figure 9.
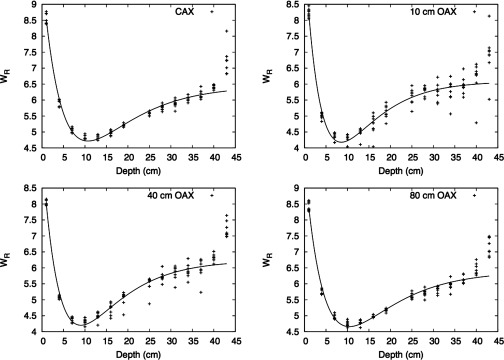
Fit for . The fit is presented as a function of depth at positions along CAX and at various OAX positions. Each type of symbol in the plot represents an energy. The plot includes all the energies at CAX and 10 40, and 80 cm OAX.
Official websites use .gov
A
.gov website belongs to an official
government organization in the United States.
Secure .gov websites use HTTPS
A lock (
) or https:// means you've safely
connected to the .gov website. Share sensitive
information only on official, secure websites.
Fit for . The fit is presented as a function of depth at positions along CAX and at various OAX positions. Each type of symbol in the plot represents an energy. The plot includes all the energies at CAX and 10 40, and 80 cm OAX.