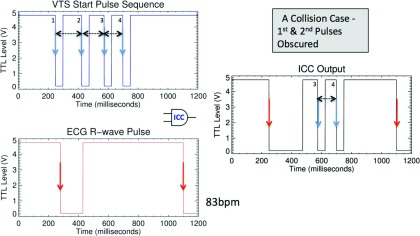
Figure 3.

Illustration of the case of “collision” between R-wave signal and VTS start pulse. (Left) Shown are the input VTS start pulse sequence at the top and the ECG R-wave signal at the bottom. (Right) Output to the BVXCT. In this case pulses 3 and 4 would be received and pulse-width 3-4 (125 ms) is known and occurs within the expected window. Start would be detected even though pulse width 1-2 and pulse width 2-3 were obscured by the R-wave signal.
