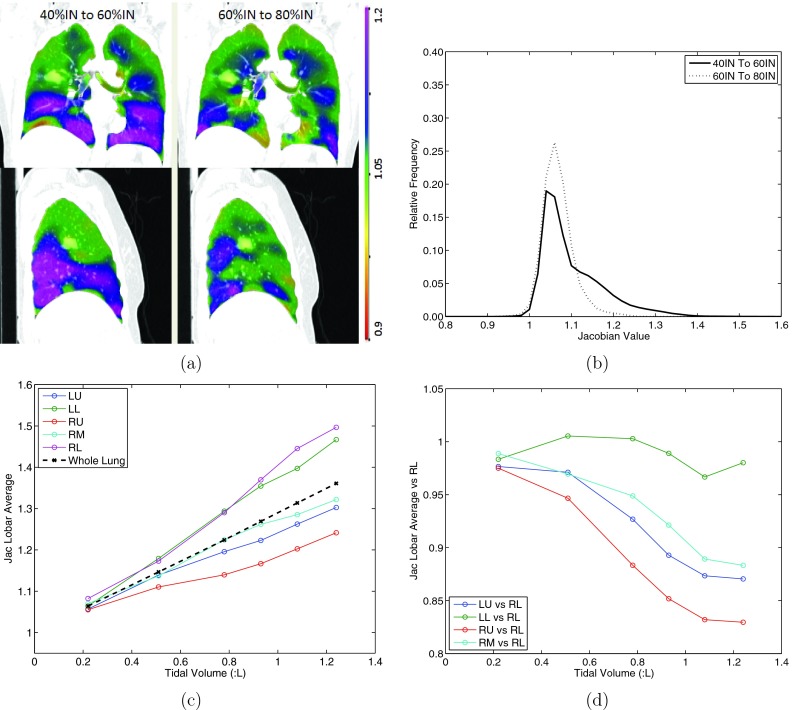
Figure 3.
A 4DCT scan is used to show the heterogenous tissue expansion rate. (a) The coronal (top) and sagittal (bottom) views of Jacobian for registration pair 40%IN to 60%IN and 60%IN to 80%IN (left to right). The scales are both 0.9 to 1.2. (b) The corresponding histograms of the two Jacobian maps in (a). (c) The average tissue expansion from EE to each respiratory phase for each lobe and the whole lung. (d) The tissue expansion for lobes LU, LL, RU, RM, relative to lobe RL.

