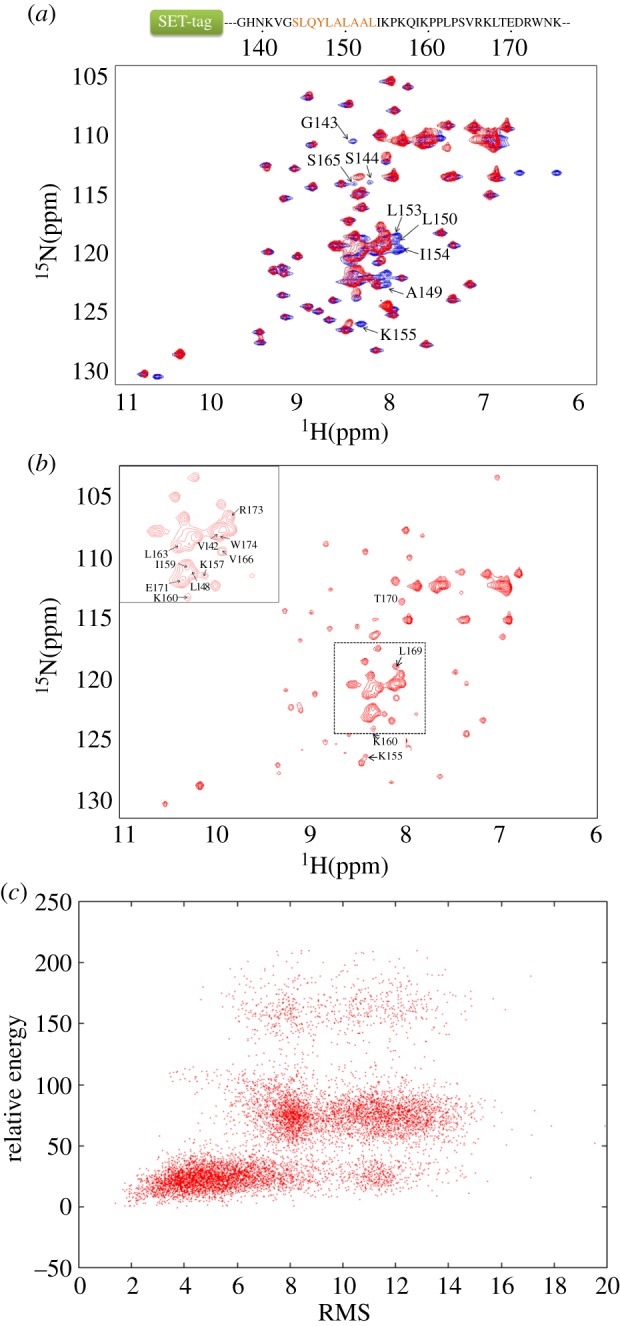
Figure 2.

1H–15N HSQC spectra of Vif SOCS-box protein, with the sequence of the SOCS-box peptide shown on top. The 56-residue SET-tag is simplified with a rectangle, followed by the SOCS-domain peptide. The BC-box is highlighted in orange. (a) The overlay of two spectra recorded on the SOCS-box peptide in the free state (blue) and in the complex with EloBC (red). (b) Details of the spectrum recorded on the bound SOCS-box peptide. The peaks assigned to residues corresponding to the Vif SOCS-box are indicated. The rest of the peaks distributing in the spectrum are from the SET-tag. (c) The Rosetta score versus RMSD plot from CS-Rosetta structural calculation protocol. A total of 10 000 structures were generated. (a,b) are reproduced with permission from [37].
