
Figure 2.
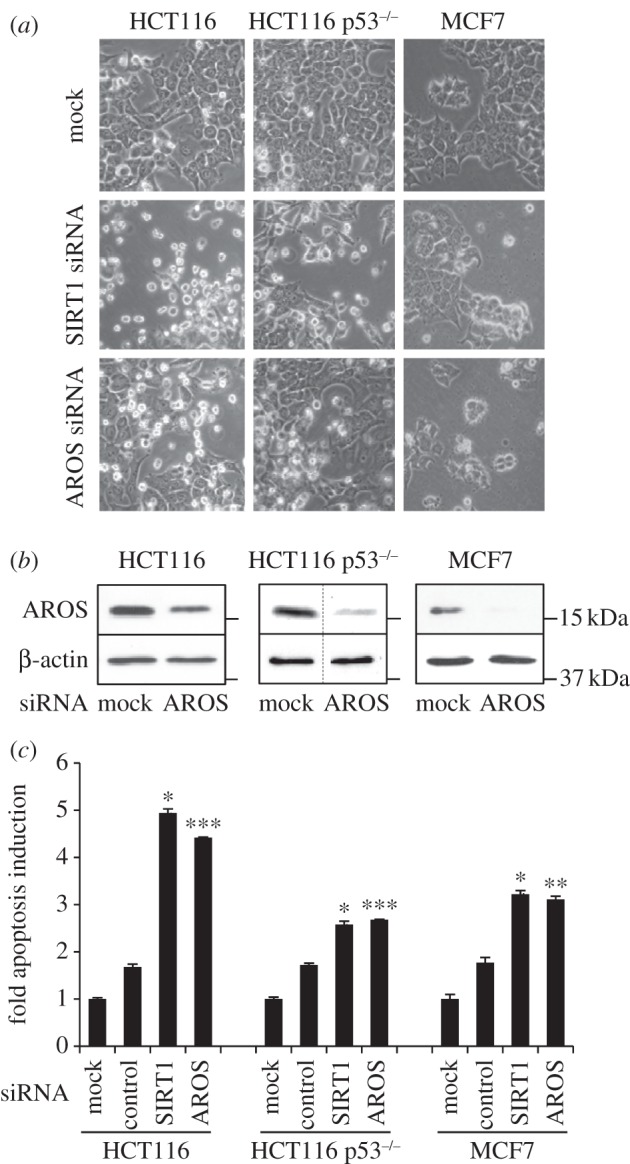
AROS promotes cancer cell line survival. (a) Phase contrast micrographs 48 h following targeting of AROS or SIRT1 in HCT116, p53 wild-type and null (p53−/−), and MCF7 cancer cells. (b) Western blotting for AROS protein following RNAi in each cell line with β-actin used as a loading control. Dashed lines within blots indicate removal of lanes from original autoradiographs. (c) Quantification of apoptotic induction in each cancer cell line following silencing of SIRT1 or AROS, including a ‘control siRNA’ that does not induce apoptosis (Lamin AC siRNA in HCT116 isogenic lines; LDH-B siRNA in MCF7 cells). Values are expressed relative to mock transfection, set to 1.0. ***p < 0.001, ** p < 0.01.