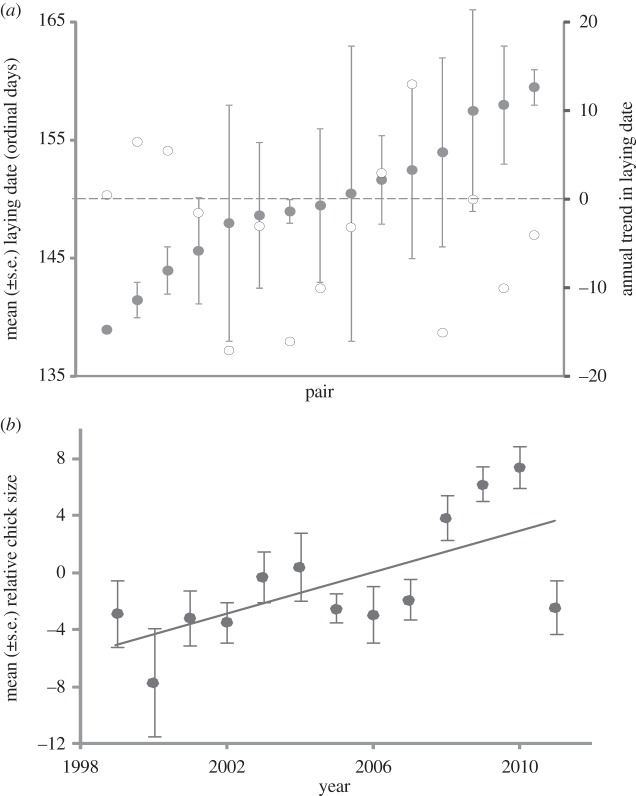
Figure 3.
(a) Laying dates of 15 pairs of individually marked black-tailed godwits recorded in between 2 and 4 years, between 2001 and 2012 (filled circles, ordered from earliest to latest) and the rates of change (open circles, days per year) in laying among these pairs, and (b) annual variation in the average relative size of black-tailed godwit chicks (residual variation from a model of total head length in relation to ordinal date of measurement y = 0.72x − 1445, r2 = 0.44, p < 0.015) hatched in different years.

