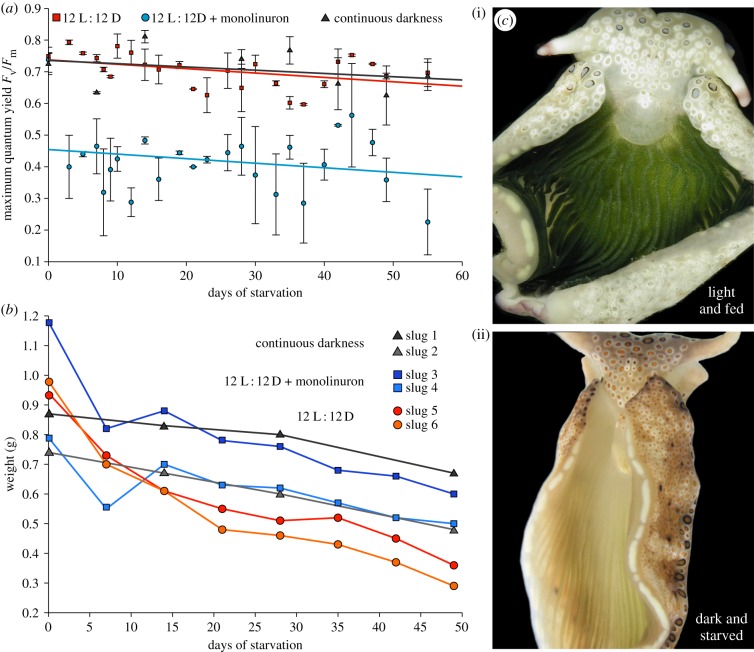
Figure 4.
Influence of photosynthesis inhibition on P. ocellatus. (a) PAM measurements of monolinuron-treated slugs in a 12 L : 12 D cycle (25 µmol quanta m−2 s−1; blue) in comparison to those kept in the dark (black) and under at a 12 L : 12 D cycle (25 µmol quanta m−2 s−1; red). Two specimens were used for each condition tested and the error bars present the standard deviation. (b) Weight measurements of the P. ocellatus specimens shown in (a). (c) Exemplary images of P. ocellatus specimens. Image (i) shows a slug kept in the light and which was regularly fed, hence best representing natural conditions. Image (ii) shows a slug after 55 days of starvation in the dark.

