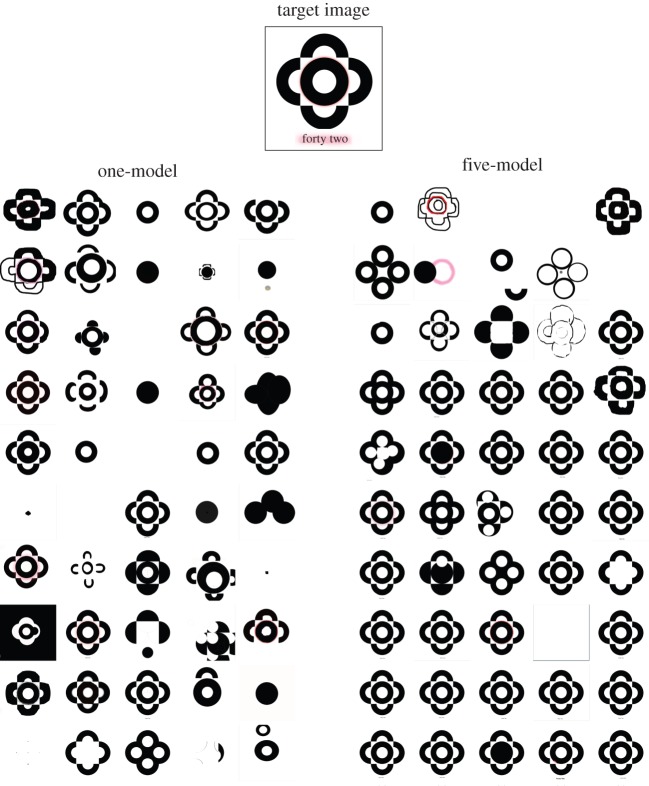
Figure 3.
Experiment 1 final images from participants in the one-model and five-model treatments. The target image is included at the top for comparison. The columns are chains of participants in the one-model treatment. Rows are generations going from top (generation 1) to bottom (generation 10). An obvious difference between the two treatments can be seen in the last row.

