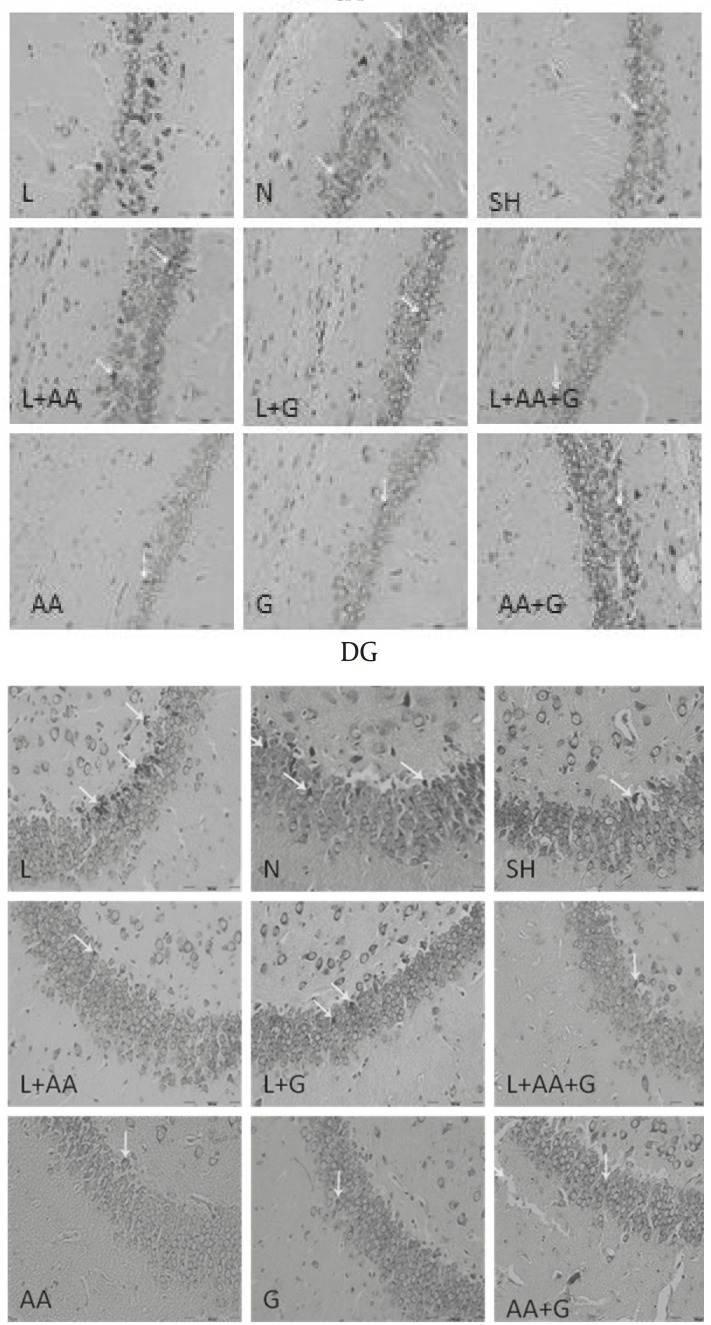
Figure 4.
Photomicrographs show the DNs in CA1, CA3 and DG hippocampal subdivisions of rat offspring at P50, Toloidin Blue Stained in the Lead-Exposed (L), Lead + Garlic (L+G), Lead + Ascorbic Acid (L+AA), Lead + Ascorbic Acid + Garlic(L+AA+G), Ascorbic Acid(AA), Garlic(G), Ascorbic Acid + Garlic (AA+G), Normal (N) and Sham (SH) groups, Arrow= Dark Neuron, (×200)

