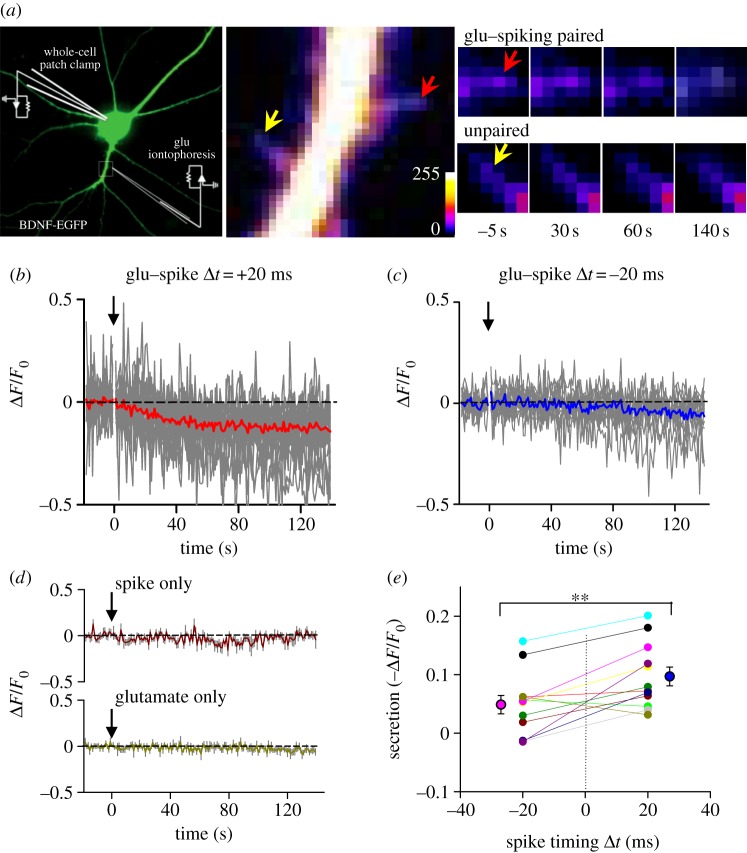
Figure 3.
Spike-timing-dependent secretion of BDNF from dendritic spines. (a) Left, an image of a cultured hippocampal neuron (DIV 16) expressing BDNF–enhanced GFP (EGFP). Right, fluorescent images of a dendrite of the neuron expressing BDNF-GFP, taken at 5 s before, 30, 60 or 140 s after the start of iontophoretic application of glutamate paired with spike triggered by an injected current (2 nA, 1 ms). The red and yellow arrows indicate a spine exposed to iontophoretic micropipette and a nearby control spine, respectively. (b–c) Fluorescence changes induced by paired iontophoretic glutamate–spike stimulation. Eighty pairs of glutamate–spike stimulation with an interval of 20 ms (glutamate before spike, n = 28) or −20 ms (glutamate after spike, n = 23) were applied at 1 Hz. Arrow: onset of stimulation at 0 s. Grey lines are traces from individual cases. Thicker red (b) or blue (c) lines are averaged traces. (d) Fluorescence changes induced by spike only (top, n = 8) or iontophoretic glutamate only (bottom, n = 10) stimulation. Eighty iontophoretic glutamate or spike stimuli were applied at 1 Hz, starting at 0 s indicated by the arrow. Coloured lines are averaged traces with grey lines which represent s.e.m. (e) Summarized results of BDNF secretion induced by paired glutamate–spike stimulation. Connected dots represent the results from the same spine (n = 12; **p < 0.005, paired t-test).

