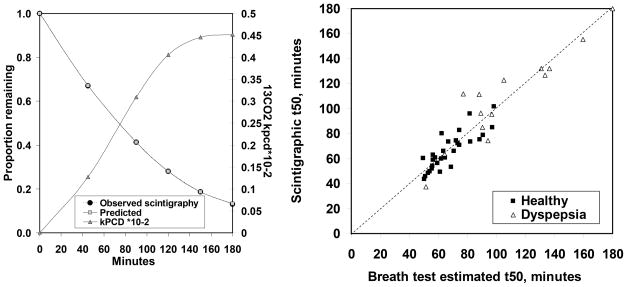
Figure 1.
Summary of gastric emptying results from the 5 time point model in 44 subjects. Left panel illustrates mean 13CO2 enrichment of breath excreted over 3 hours (right Y-axis κPCD × 10−2), as well as the mean observed proportion emptied from the stomach by scintigraphy (left Y-axis) and the mean predicted GE based on the bootstrap regression model using the measured 13CO2 excretion. The observed (scintigraphic) and predicted (GEBT) values are nearly identical; hence superimposed. Right panel illustrates scatterplot of the scintigraphic measured GE t50 values (Y-axis) versus the breath test estimated t50 values (X-axis) obtained from linear interpolation of breath test predicted GE proportions based on the 5 time points model. Only data up to 180 minutes were used in this model. Hence t50 was censored at 180 minutes in 2 subjects. The dotted line shows X=Y.

