
Figure 4.
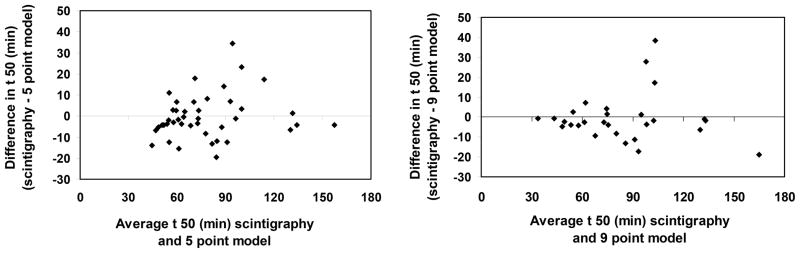
Bland Altman Plots for 5 point (left panel) and 9 point (right panel) for t50 estimated by GEBT versus scintigraphy.
Official websites use .gov
A
.gov website belongs to an official
government organization in the United States.
Secure .gov websites use HTTPS
A lock (
) or https:// means you've safely
connected to the .gov website. Share sensitive
information only on official, secure websites.
Bland Altman Plots for 5 point (left panel) and 9 point (right panel) for t50 estimated by GEBT versus scintigraphy.