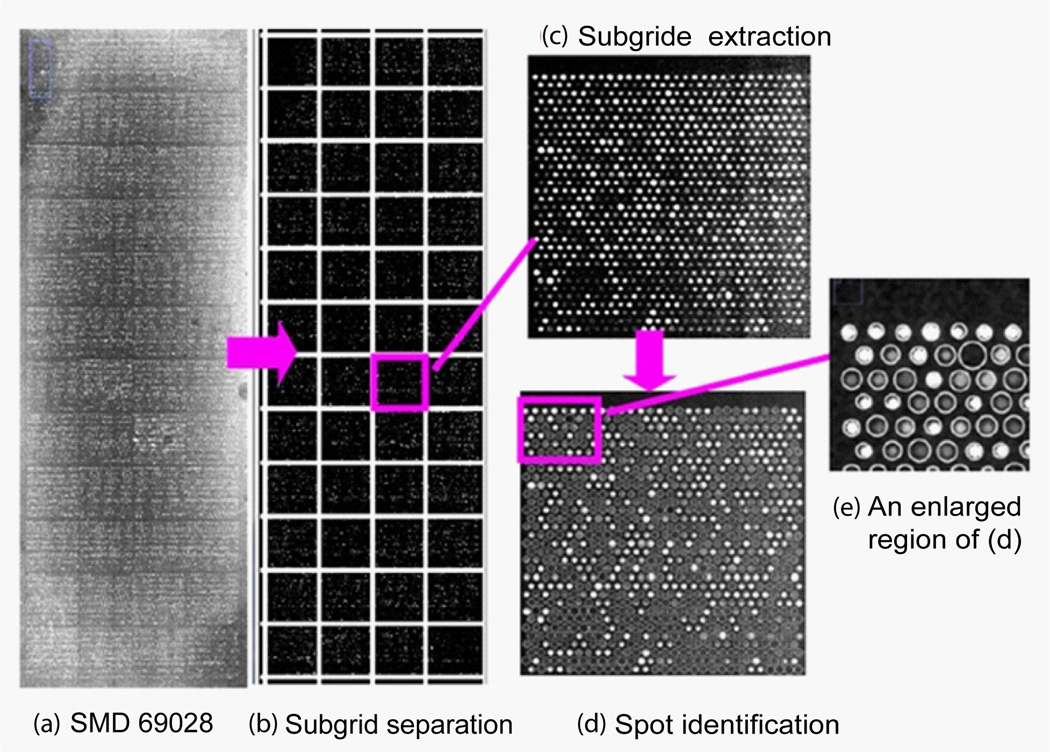
Figure 17.
(a) Microarray image of SMD69028 channel 1 downloaded from smd.stanford.edu. This image contains 4×12 subgrids. (b) The separation lines for columns and rows are produced with the auto-spot method and are shown as white overlay lines. (c) A subgrid extracted from the image, where spots are arranged in hexagonal pattern. (d) The spot identification result with the auto-spot method. The white circles indicate the locations and sizes of the spots. (e) An enlarged region of the spot identification result.

