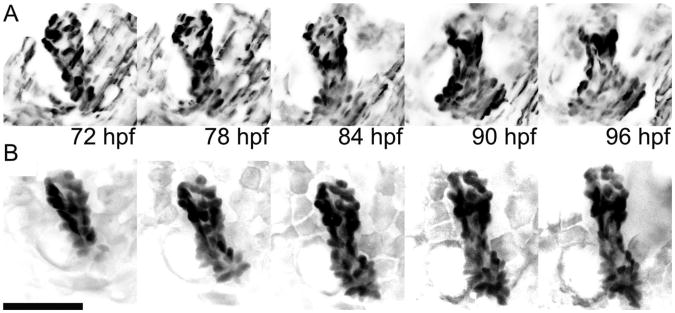
Figure 3.
Maximum intensity projections of three dimensional scans of EGFP-expressing osteoblast cells in a developing opercle, as imaged with light sheet (A) and confocal (B) microscopy using equivalent exposure conditions. Image intensities have been inverted for clarity. One three-dimensional data set was acquired every ten minutes over the course of twenty-four hours; the images shown are separated by six hour intervals. The scale bar length is 50 microns.

