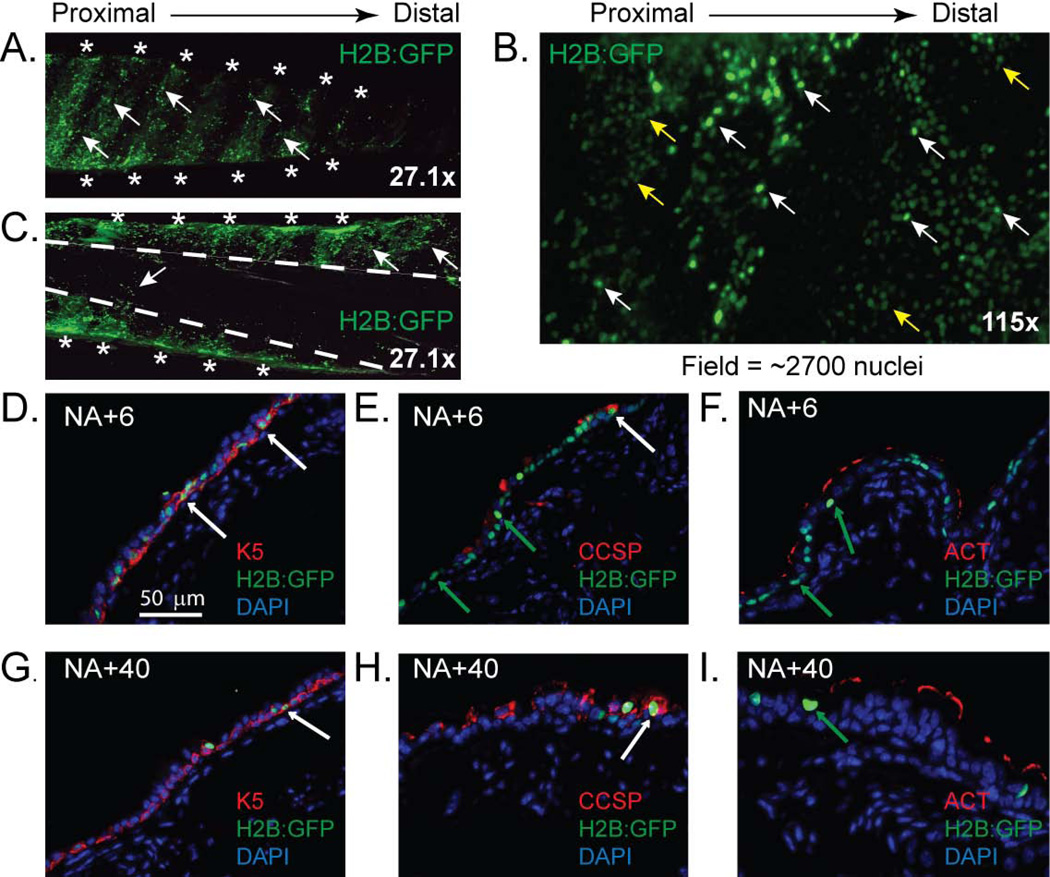
Figure 2. Localization and phenotype of Histone 2B:GFP positive (H2B:GFP+) cells.
(A–C) Whole mount images of trachea recovered from doxycycline (dox) and naphthalene (NA)-treated mice on recovery day 40. (A, C) external and (B) luminal surface. Asterisks: cartilage rings. Dashed lines: border between cartilaginous and membranous regions. Arrows: white-GFP+; yellow-GFPlow nuclei. (D–I) Dual immunofluorescence analysis of H2B:GFP+ cell phenotype on recovery day 6 (D–F) or 40 (G–I). Arrows: white H2B:GFP+ cells that co-express Keratin (K) 5 (D, G) or CCSP (E, H); green: H2B:GFP+ cells that do not express CCSP (E, H) or ACT (F, I) (n=6 tracheas).

