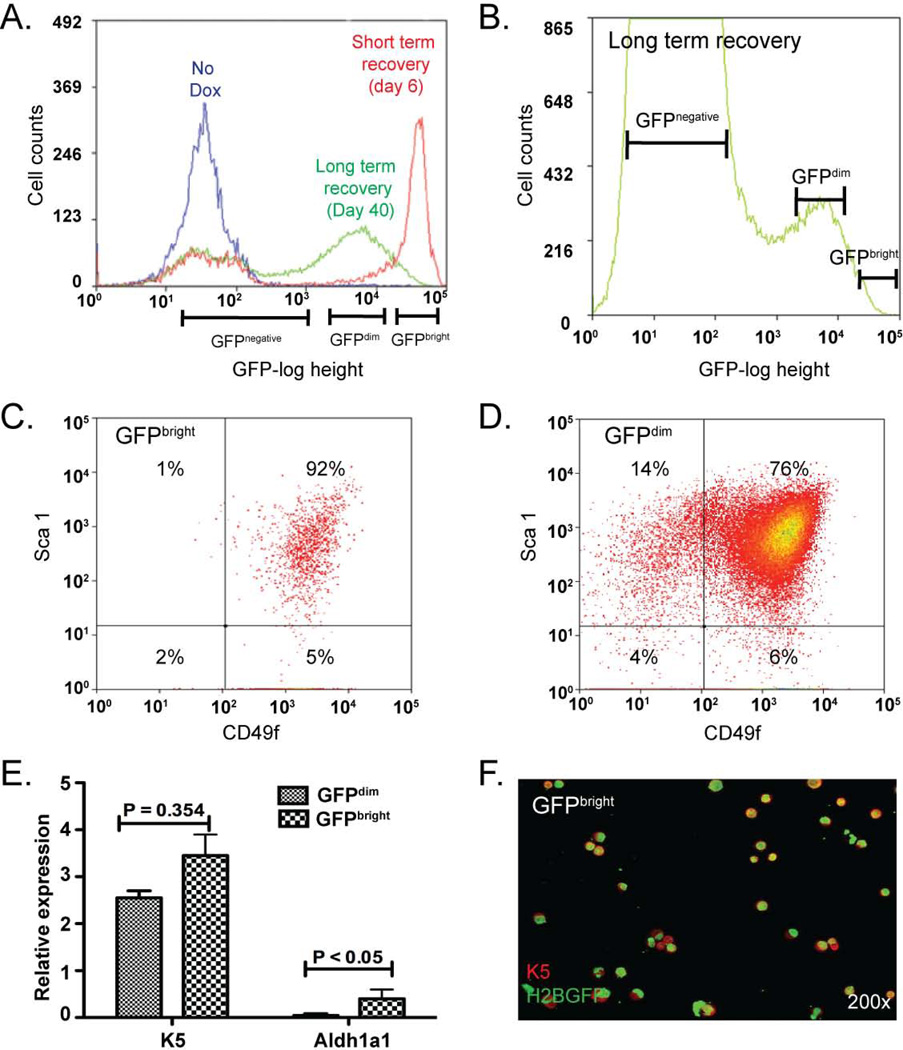
Figure 3. Isolation of viable Histone 2B:GFPbright (GFPbright) cells.
(A–B) FLOW cytometry histograms depicting cell count vs. GFP fluorescence intensity for CD45-/CD31-/TER119-/DAPI- cells derived from bitransgenic (BiTg) mice fed standard chow (no Dox, blue line) or BiTg mice fed doxycycline (dox) chow and treated with naphthalene (NA). Cells from dox/NA treated mice were evaluated on recovery day 6 (short term recovery, red line) or day 40 (long term recovery, green line). (C–D) Flow cytometry bivariate plots depicting the Sca1 and CD49f surface phenotype of GFPbright (C) and GFPdim (D) cells. (n = 7 analyses). (E) Real time RT-PCR analysis of Keratin (K) 5 and aldehyde dehydrogenase 1a1 (Aldh1a1) mRNAs in GFPbright (small check) and GFPdim (large check) populations. Mean ± SEM (n=4). (F) Dual immunofluorescence analysis of Keratin (K) 5 and GFP expression in cytospin preparations of GFPbright cells. (n= 4 analyses).

