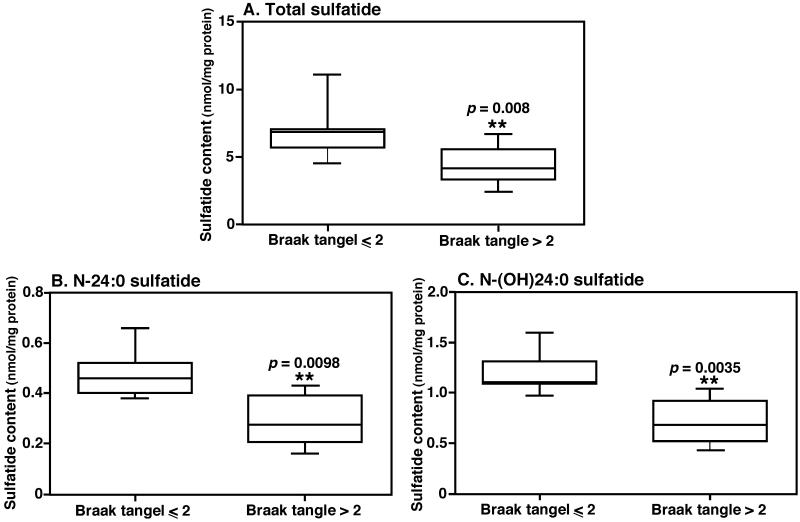
Figure 1.
Significant depletion of sulfatide in preclinical AD. The boxplots illustrate the levels of total sulfatide (A), N-24:0 sulfatide (B), and N-(OH)24:0 sulfatide (C), which are significantly lower in preclinical AD (Braak tangle > II, n = 6) compared to the controls (Braak tangle > II, n = 8). The levels of individual sulfatide species in lipid extract of brain samples were determined by MALDI-TOF/MS and presented after normalization to the protein content of each tissue sample.

