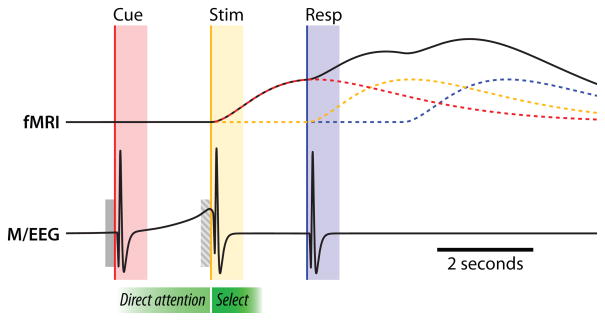
Figure 2.
Schematic showing simplified, idealized signals that could be obtained using fMRI (BOLD response) and M/EEG (field strength or electric potentials) in a sample experiment. The three parts of a trial (cue, red; stimulus, yellow; and response, blue) all elicit a neural response. In the BOLD signal, these responses overlap and sum as a result of their extended time courses (note also the 2 s delay; Boynton et al., 1996), making timing-based analysis difficult. A catch trial (presenting a cue without a subsequent stimulus) can be used to isolate the response in the cue-stimulus interval [i.e., removing the stimulus (yellow) contribution in the overall (black) time course]. With M/EEG data, the responses are brief and separable, allowing identification of the preparatory attentional signal preceding the stimulus period (yellow). Gray bars denote the common practice of baseline correction using the pre-cue (solid) or the pre-stimulus (hatch) interval. See Section 3 for in-depth discussion.

