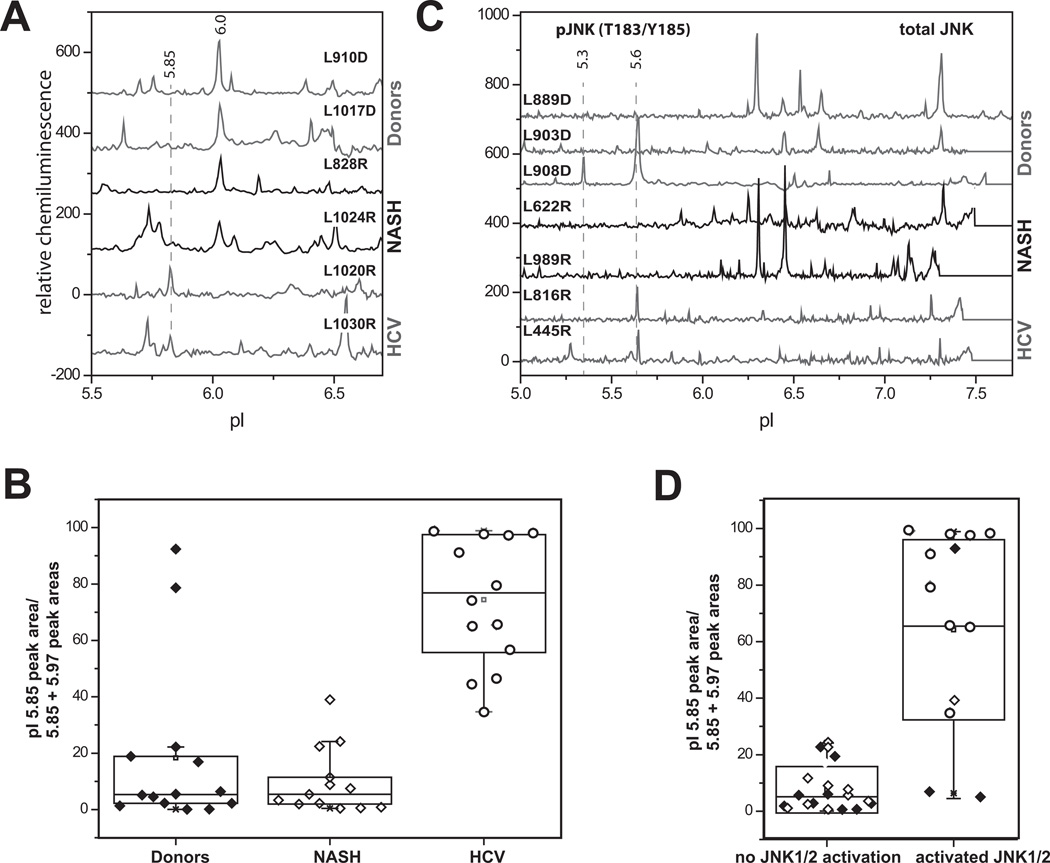
Figure 7. FOXO3 modifications in human Hepatitis C infection.
A. Examples of cIEF analysis of FOXO3 nuclear species in donor livers, NASH and livers of HCV-positive patients. Baseline levels of each trace were shifted as for Fig. 1. B. Quantification of the pI 5.85 peak area divided by the total area under pI 5.85 and pI 5.97 peaks in three groups as indicated. C. Examples of cIEF analysis of JNK species detected by anti-total JNK ab in donor livers, NASH and livers of HCV-positive patients. pJNKT183/Y185 species are indicated by dashed lines. Baseline levels of each trace were shifted as for Fig. 1. D. pI 5.85/[pI 5.85 + pI 5.97] values as in B in the samples of patients with pJNK species present (right) or no pJNK species present (left). Donor samples are shown in black diamonds, NASH – in white diamonds and HCV-positive – in circles.

