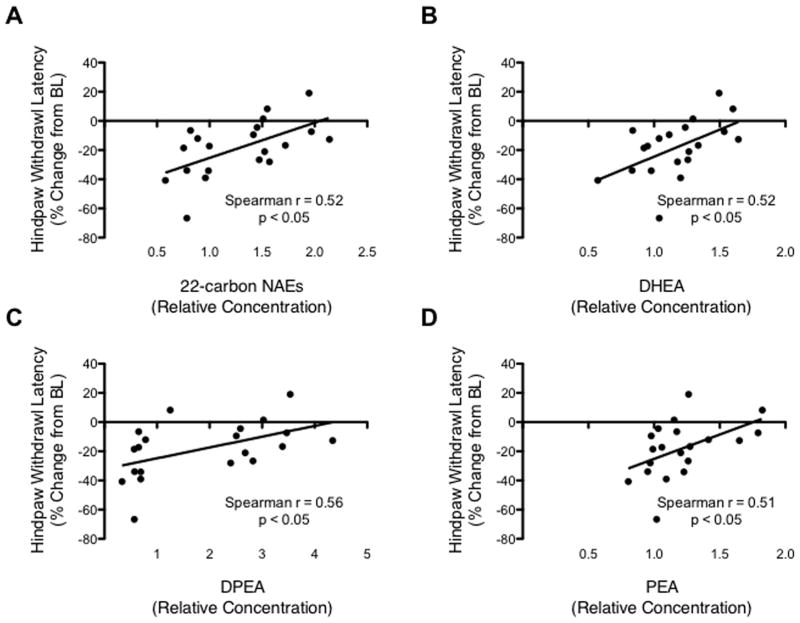
Figure 5.
Metabolic features correlated with pain-like phenotypes. Scatter plot shows the significant relationship between the levels of (A) ethanolamines containing 22-carbon N-acyl chains, (B) GP-DHEA, (C) GP-DPEA, (D) PEA and the hindpaw thermal withdrawal latency change from baseline. For every correlation, the Spearman r was higher than 0.50, with a p < 0.05, XY = 20 pairs.

