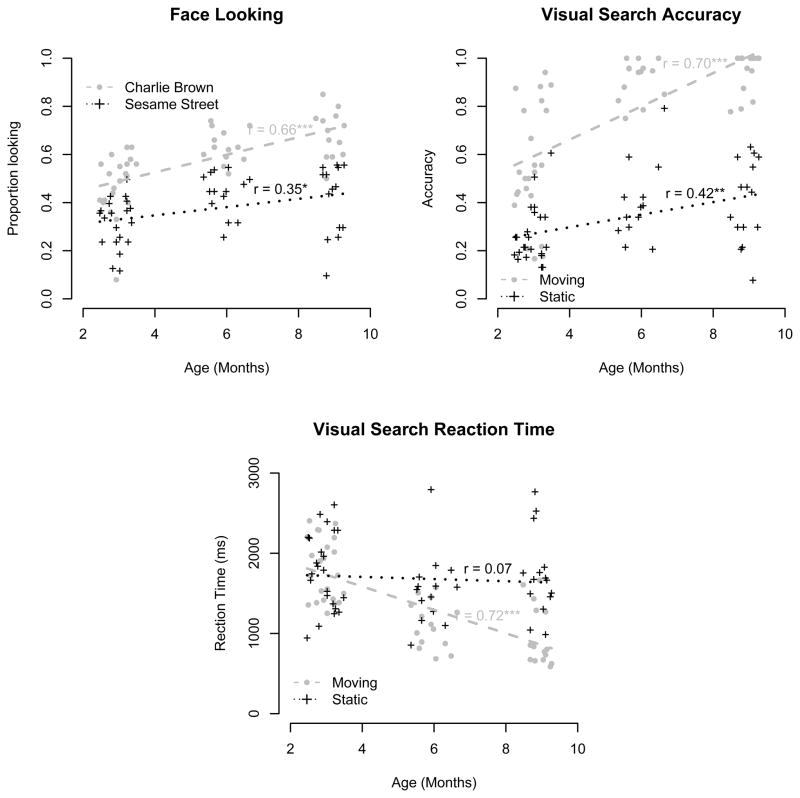
Figure 2.
Proportion looking at faces (left top), visual search accuracy (right top), and visual search reaction time (bottom), plotted by age in months. Dashed/dotted lines and crosses/open circles show individual participants and line of best fit for each condition (either Charlie Brown vs. Sesame Street, or static vs. moving targets), respectively. A * indicates p < .05, ** indicates p < .01 and *** indicates p < .001.

