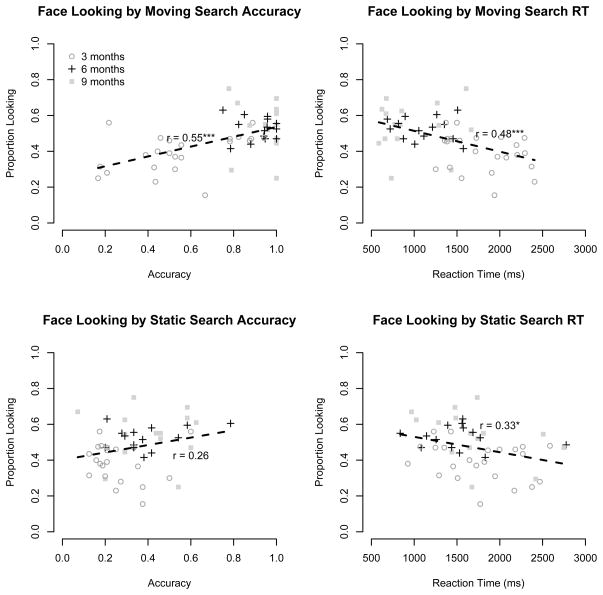
Figure 4.
Average proportion of face looking during Charlie Brown and Sesame Street, plotted by accuracy (left panels) and reaction time (right panels) in moving (top panels) and static (bottom panels) search tasks for all three age groups. Individual 3-, 6, and 9-month-olds are shown by open circles, crosses, and filled squares respectively, with the dashed line showing a line of best fit. A * indicates p < .05 and *** indicates p < .001.

