Figure 4.
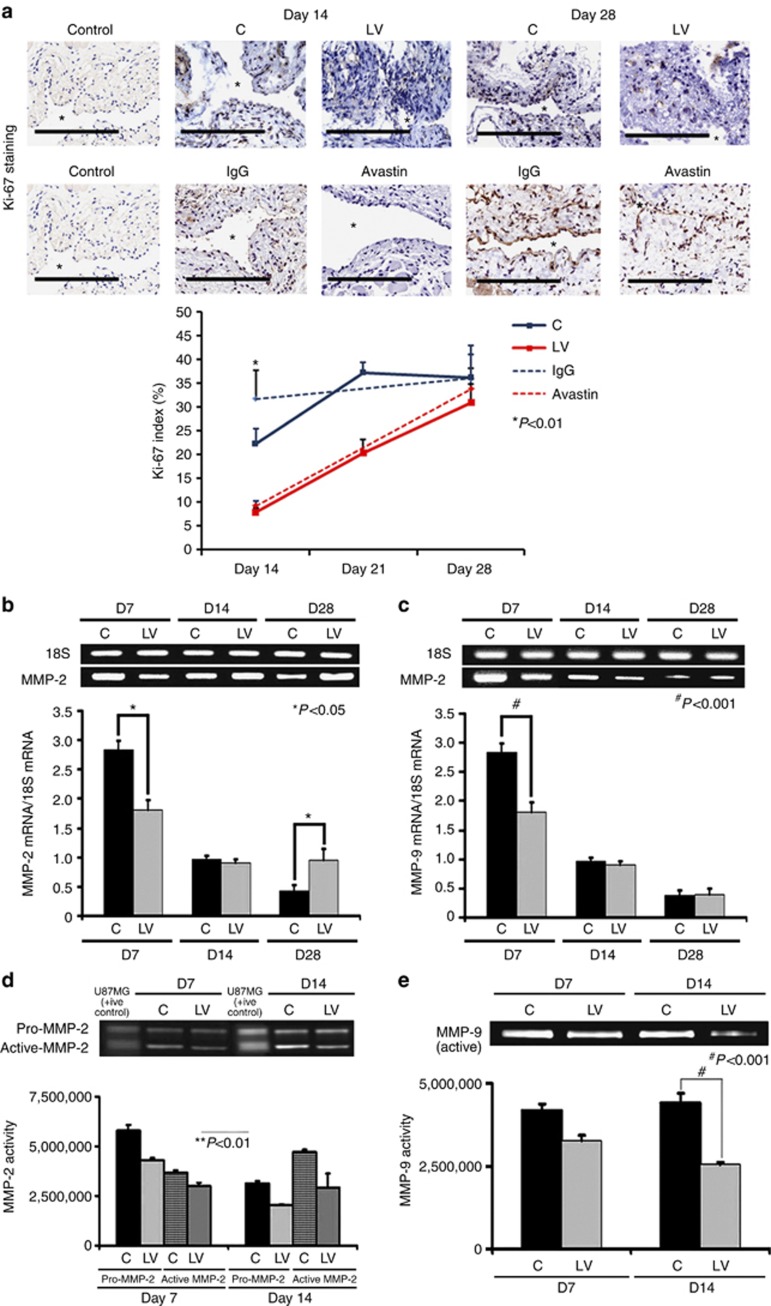
Cellular proliferation, matrix metalloproteinase 2 (MMP-2), and matrix metalloproteinase 9 (MMP-9) are decreased in lentivirus (LV)–small hairpin RNA (shRNA)–vascular endothelial growth factor-A (VEGF-A)–transduced vessels. (a, upper panel) Representative sections after Ki-67 staining at the venous stenosis of the LV-shRNA-VEGF-A (LV) and scrambled shRNA (control (C)) or Avastin-treated vessels or immunoglobulin G (IgG) controls at days 14 (D14) and 28 (D28). Nuclei staining brown are positive for Ki-67. IgG antibody staining was performed to serve as negative controls. *Indicates the lumen. All are original magnification × 40. Bar=200 μm. Pooled data for the LV and C groups or Avastin-treated vessels or IgG controls are shown in the lower panel. This demonstrates a significant decrease in the mean Ki-67 index in the LV-transduced vessels when compared with the C vessels at day 14 (P<0.01). Similar results are seen with Avastin-treated vessels when compared with controls at day 14 (P<0.01). Significant difference from control value is indicated by **P<0.001. Each bar shows mean±s.e.m. of four animals per group. Pooled data for real-time PCR (RT-PCR) analysis of (b) MMP-2 and (c) MMP-9 expression after transduction with either LV or C are shown. This demonstrates a significant reduction in the average amount of (b) MMP-2 and (c) MMP-9 in the LV-transduced vessels when compared with C vessels at day 7 (P<0.0001) with a significant increase in MMP-2 by day 28 (P<0.01). Significant difference from control value is indicated by *P<0.01 and #P<0.0001. (b, c) Each bar shows mean±s.e.m. of four animals per group. A representative zymogram for (d) MMP-2 and (e) MMP-9 is shown in the upper panel and the pooled data in the lower panels. By zymography, (d) pro-MMP-2 expression was significantly decreased in the LV-transduced vessels when compared with C vessels at day 7 (P<0.0001), and by day 14 both pro and active MMP-2 were significantly decreased (both P<0.0001). By zymography, (e) active-MMP-9 expression was significantly decreased in the LV-transduced vessels when compared with C vessels at day 14 (P<0.001). (d, e) Each bar shows mean±s.e.m. of 3–6 animals per group. Two-way analysis of variance (ANOVA) followed by Student's t-test with post hoc Bonferroni's correction was performed. Significant difference from control value is indicated by *P<0.01, **P<0.001, or #P<0.0001.

