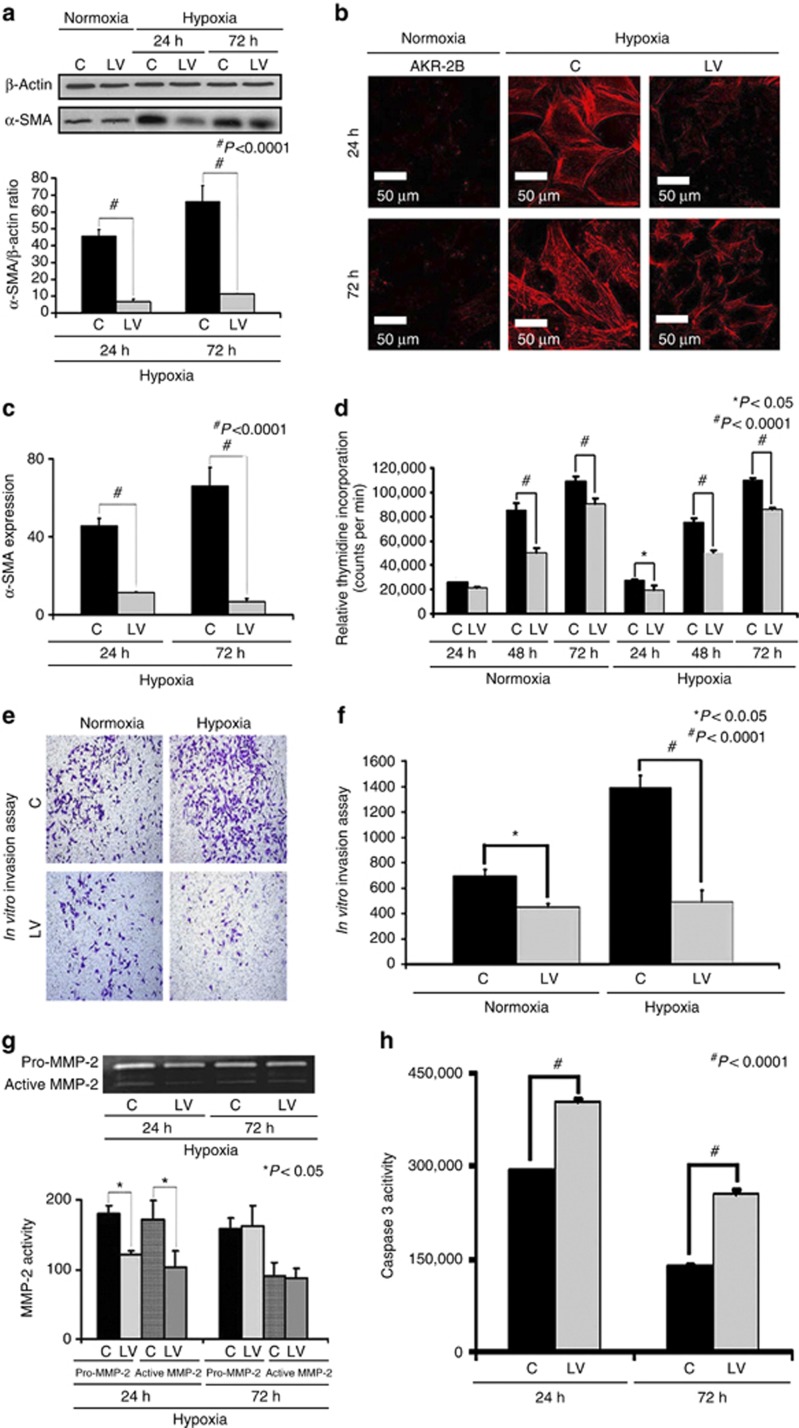
Figure 7.
There is decreased proliferation, invasion, α-smooth muscle actin (α-SMA), and matrix metalloproteinase 2 (MMP-2) expression with increased caspase 3 activities in the lentivirus (LV)–small hairpin RNA (shRNA)–vascular endothelial growth factor-A (VEGF-A)–transduced cells subjected to hypoxia. Western blot for α-SMA after transduction LV-shRNA-VEGF-A (LV) and scrambled shRNA-VEGF-A (C) in AKR-2B fibroblasts subjected to hypoxia at 24 and 72 h. A typical western blot is shown in the upper panel and the pooled data in the lower panel (a). This demonstrates a significant reduction in the mean α-SMA expression in the LV-transduced cells when compared with C cells at 24 (P<0.0001) and 72 h (P<0.0001). (b) Staining for α-SMA (red positive cells) at 24 and 72 h. (c) Pooled data for the average intensity of cells staining positive for α-SMA, demonstrating a significant decrease in the LV-transduced cells when compared with C cells at both 24 and 72 h (both P<0.001). (d) Pooled data for proliferation using the thymidine incorporation assay for the LV-transduced cells when compared with C cells, showing a significant decrease in proliferation for the normoxic groups at 48 and 72 h (P<0.0001) and for 24 (P<0.05), 48, and 72 h (P<0.0001) of hypoxia. (e) Invasion assay for LV-transduced cells when compared with C cells for normoxia and hypoxia. (f) Pooled data for invasion of the LV-transduced cells when compared with C cells, showing a significant decrease in both the normoxic (P<0.0001) and hypoxic groups (P<0.0001). (g) Upper panel is a representative zymogram of LV-transduced cells when compared with C cells subjected to hypoxia at 24 and 72 h, and the lower panel shows pooled data demonstrating a significant reduction in both pro- and active-MMP-2 activity at 24 h for LV-transduced cells when compared with C cells (P<0.05). (h) Pooled caspase 3 activity in LV-transduced cells when compared with C cells subjected to hypoxia at 24 and 72 h, showing a significant increase in the mean caspase 3 activity in the LV-transduced cells when compared with C cells at 24 and 72 h (both P<0.0001). (c) Each bar shows mean±s.e.m. of 3–6 different experiments per group. Two-way analysis of variance (ANOVA) followed by Student's t-test with post hoc Bonferroni's correction was performed. Significant difference from control value is indicated by *P<0.05, **P<0.01, or #P<0.001.

