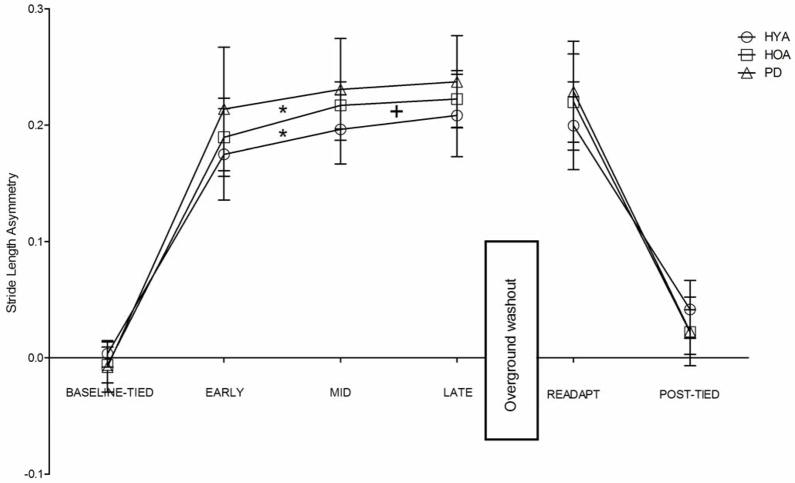
Figure 3.
Comparisons of stride length asymmetry among groups and across all walking conditions. HYA – healthy young adults, HOA- healthy older adults, PD – persons with Parkinson’s disease. Error bars indicate standard deviation. *indicates that stride length asymmetry during MID adaptation was significantly higher than during EARLY adaptation with p<.05. + indicates that stride length asymmetry during LATE adaptation was significantly higher than during MID adaptation with p<.05.

