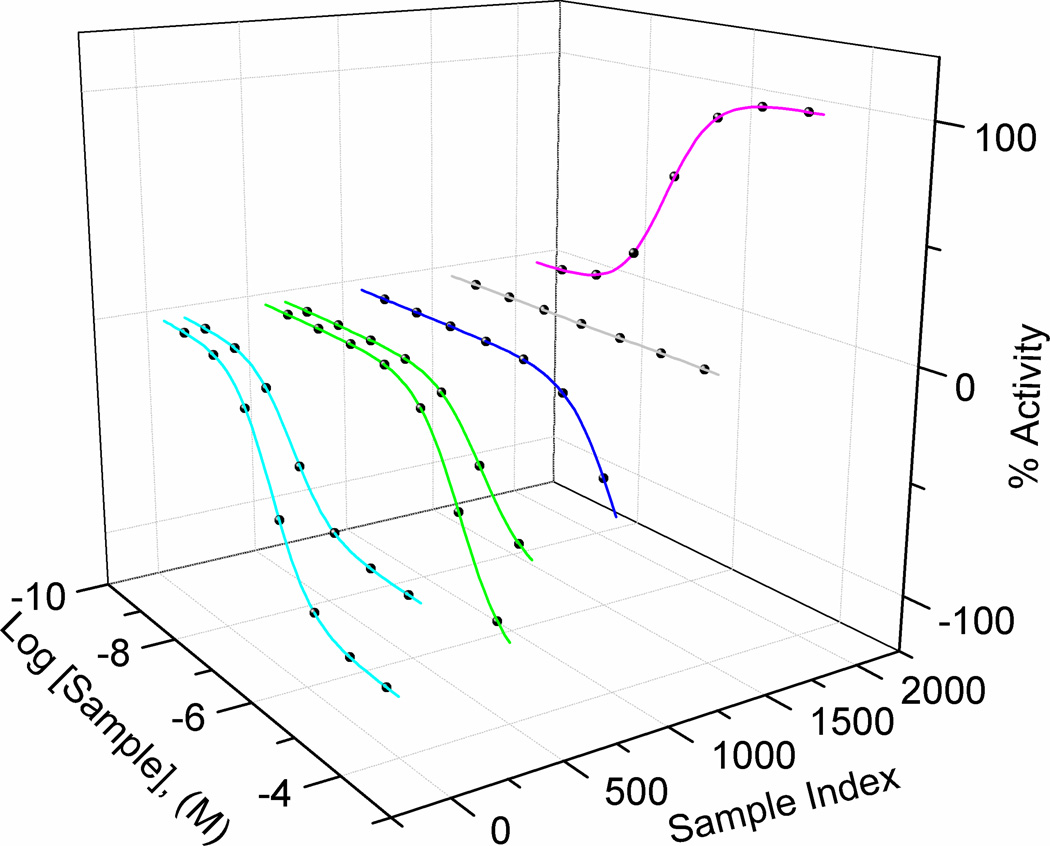
Figure I.
qHTS curve classification graphic. Concentration-response curves generated from 4-parameter fits to experimental data are categorized into curve class (CC) according to Inglese et al. [91], where magenta, CC=−1a and −1b (left to right); green, CC=−2a and −2b, dark blue, CC=−3; and grey, CC=4 (inactive). The sign (− or +) indicates inhibitory or stimulatory, for example, the purple curve is a stimulatory 1a curve. The ‘a’ and ‘b’ designate a fully efficacious (relative to control) vs. a partially efficacious effect, respectively.

