Figure 1.

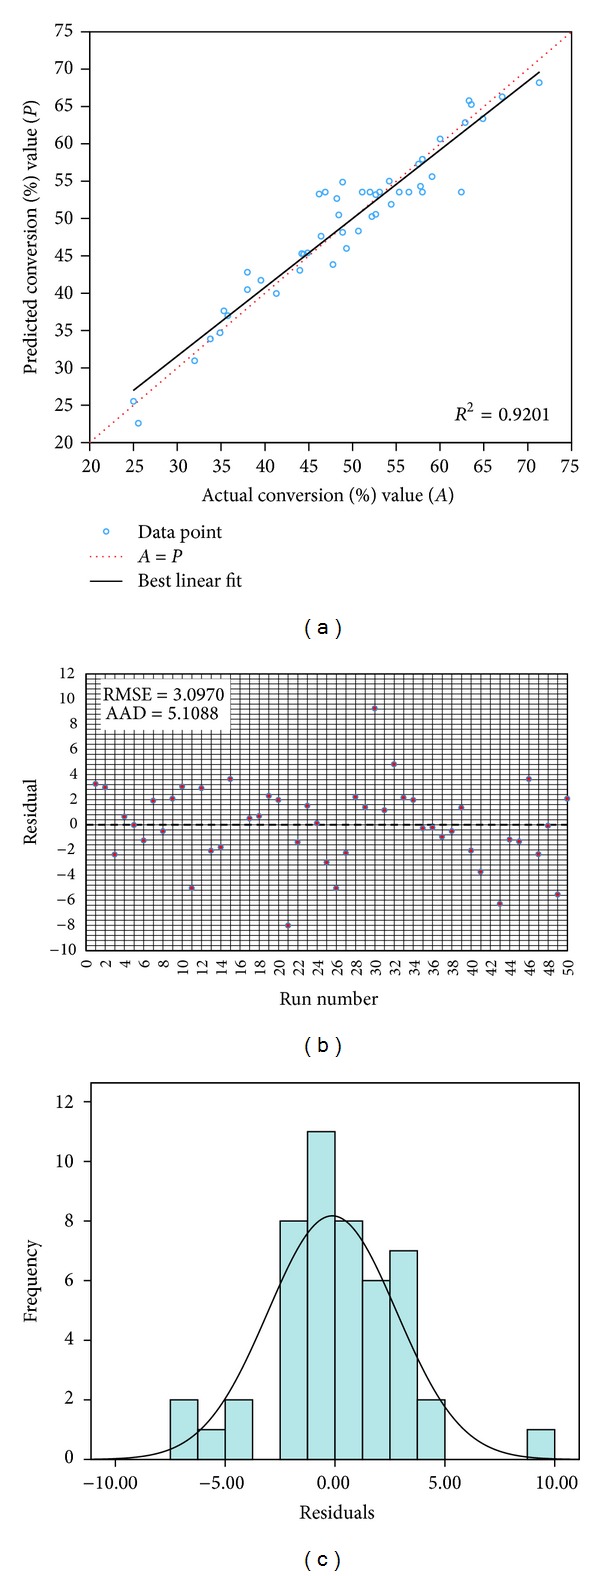
(a) Scatter plot of predicted conversion% value versus actual conversion% value (b) residual plot of runs from central composite design (c) histogram of residuals with normal overlay.

(a) Scatter plot of predicted conversion% value versus actual conversion% value (b) residual plot of runs from central composite design (c) histogram of residuals with normal overlay.