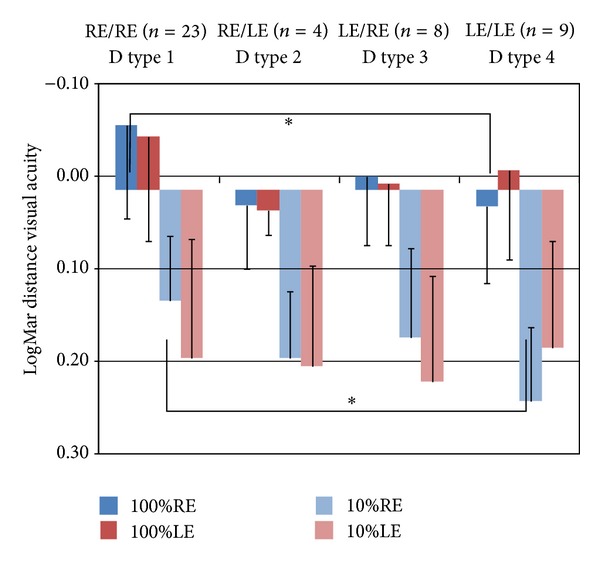
Figure 1.

Mean best corrected visual acuity in distance vision and standard deviation for every dominance type (1 to 4): high contrast (100%), low contrast (10%) for right (RE) and left (LE). The values of VA are represented in LogMAR units. *P < 0.05 in comparison.
