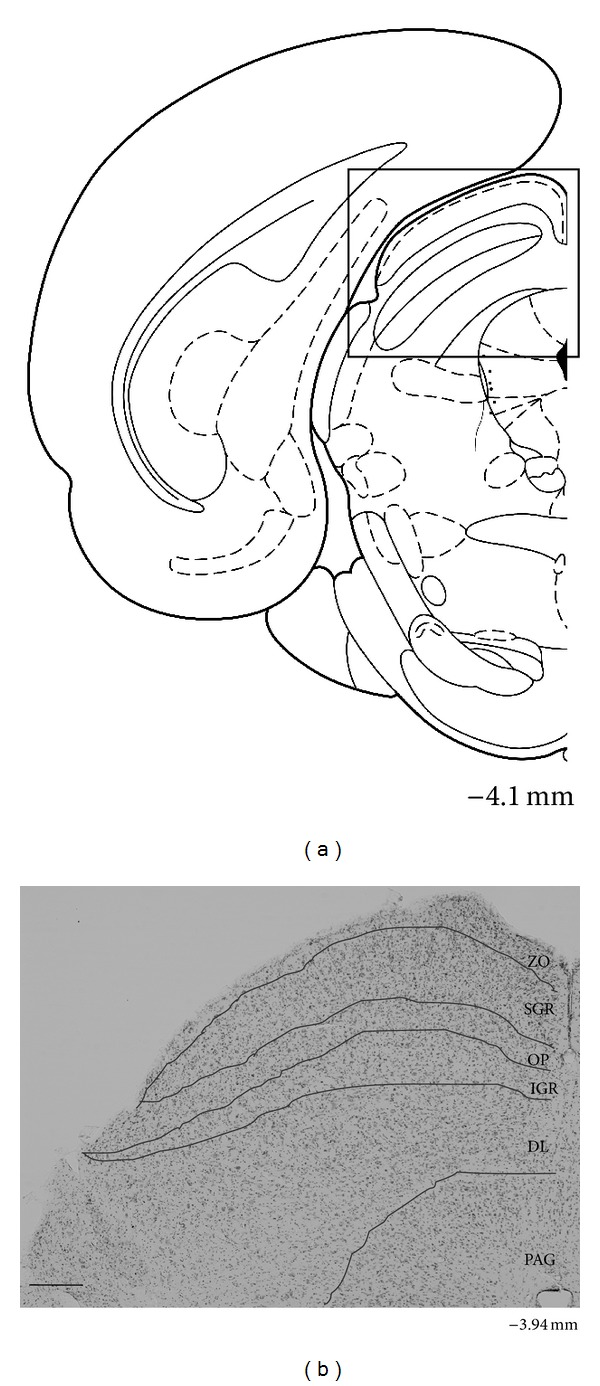
Figure 1.

Coronal section in the brain atlas (AP, −4.1 mm from the bregma) (a) and representative section stained with cresyl violet (AP, −3.94 mm from the bregma) (b) showing the location and laminar pattern of the mouse SC. The square in A indicates the SC region. ZO zonale; SGR superficial gray layer; OP optic; IGR intermediate gray layer; DL, deep layer; and PAG periaqueductal gray matter. Scale bar = 200 μm.
