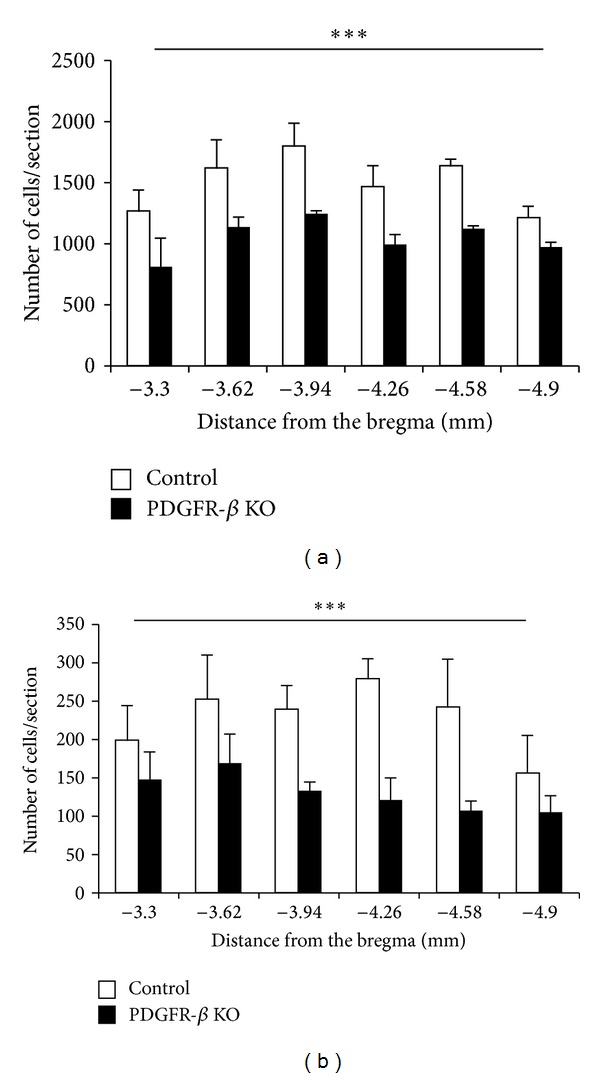
Figure 9.

Comparison of mean number of Otx2-IR (a) and PV-IR (b) cells in the SC between the control (open columns) and KO mice (black columns). Each value represents the mean ± SEM. Numbers below the abscissa indicate the rostrocaudal distance from the bregma. Error bars indicate standard deviation. *** Significant difference between the control and KO mice (P < 0.001, repeated measures two-way ANOVA).
