
Figure 4.
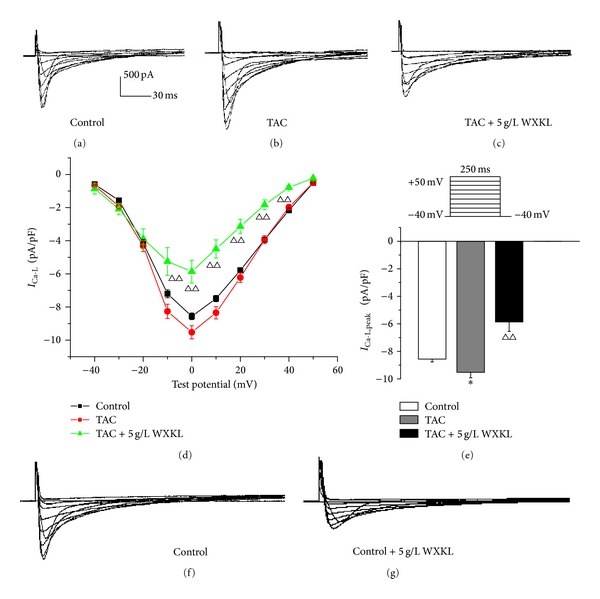
Effects of WXKL on the I Ca-L in the TAC group. (a) Representative I Ca-L traces recorded from the control group. (b) Representative I Ca-L traces recorded from the TAC group. (c) Representative I Ca-L traces recorded from the TAC group in the presence of 5 g/L WXKL. (d) The peak current density-voltage relationship showed that the current densities in the TAC group were significantly increased by a range of −10 mV to +10 mV, and the current densities in the TAC group after treatment with 5 g/L WXKL were significantly reduced by a range of −10 mV to +40 mV. (e) The peak current densities in each group exhibited significant differences. ((f) and (g)) Representative I Ca-L traces recorded from the control group and after treatment with 5 g/L WXKL. *P < 0.05 and **P < 0.01 versus the control group. Δ P < 0.05 and ΔΔ P < 0.01 versus the TAC group.