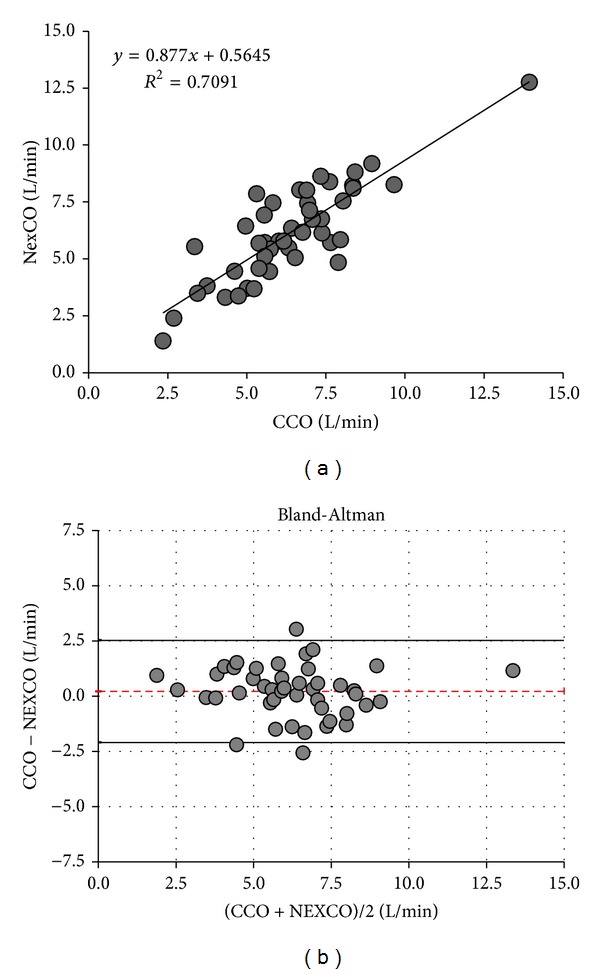
Figure 2.

Cardiac output measurements: CCO versus NexCO. Only one average value per patient is plotted. (a) Regression analysis. (b) Bland-Altman analysis. Patient averages with the mean cardiac output ranges (x-axis) and errors (y-axis) during the 8-hour study period. Dotted line indicates bias and solid lines indicate lower and upper limit of agreement. CCO: pulse contour continuous cardiac output NexCO: Nexfin cardiac output.
