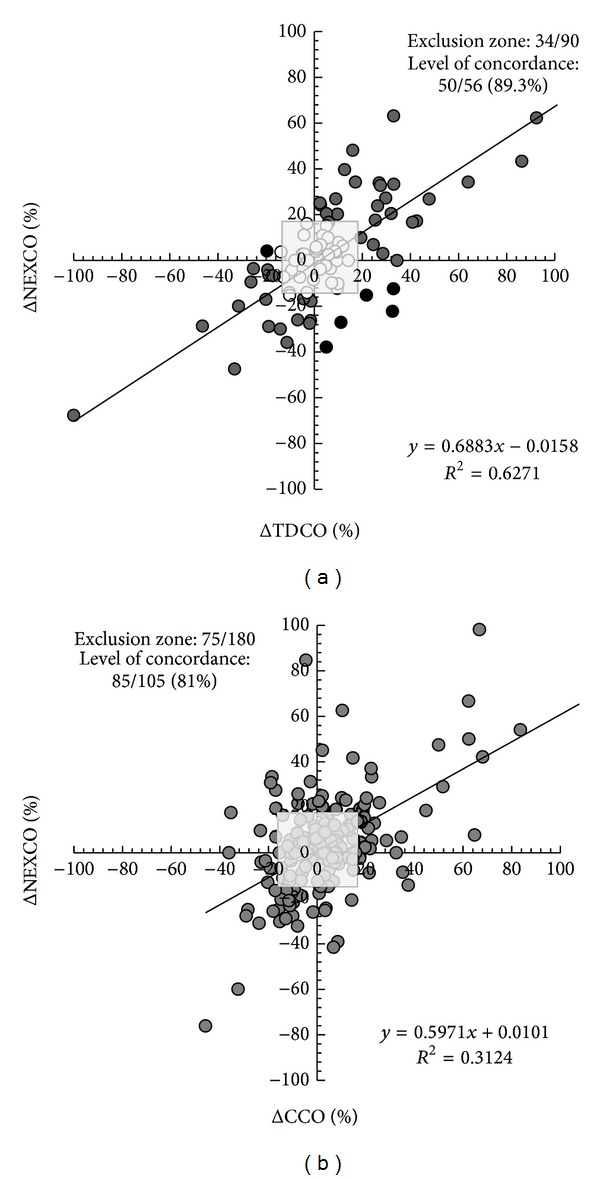
Figure 3.

Four quadrants trend plot. (a) Plot for 90 paired measurements of ΔNeXCO and ΔTDCO. From the 90 initial paired measurements, 34 pairs were excluded (exclusion zone is indicated as grey dots within grey-shaded square) because either ΔNexCO or ΔTDCO was ≤ ±15% or because ΔNexCO or ΔTDCO was equal to zero. The calculated level of concordance was 89.3% (50/56) (6 pairs felt within the upper left or lower right quadrant and correspond to poor concordance, black dots). See text for explanation. (b) Plot for 180 paired measurements of ΔNeXCO and ΔCCO. From the 180 initial paired measurements, 75 pairs were excluded (exclusion zone is indicated as grey-shaded square) because either ΔNexCO or ΔCCO was ≤ ±15% change or because ΔNexCO or ΔCCO was equal to zero. The calculated level of concordance was 81% (85/105). See text for explanation.
