
Figure 4.
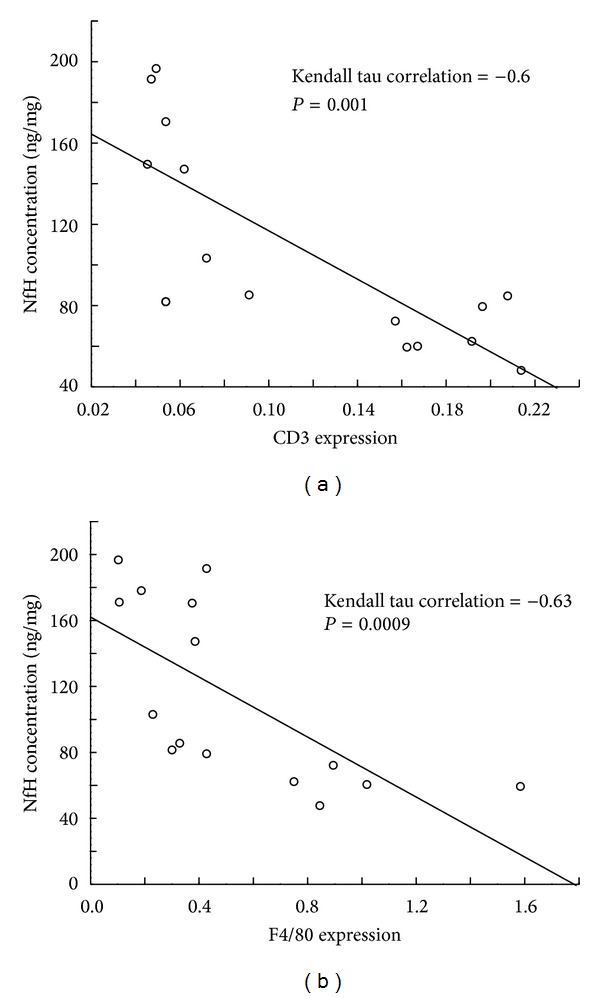
Positive correlation between development of inflammation measured by expression of T cell line marker CD3 (a) and macrophage marker F4/80 (b) with intensity of neurodegeneration measured by ELISA for phosphorylated neurofilaments in ET-1 injected ischemic hemisphere. ET-1 model of stroke was induced as described in Section 2.