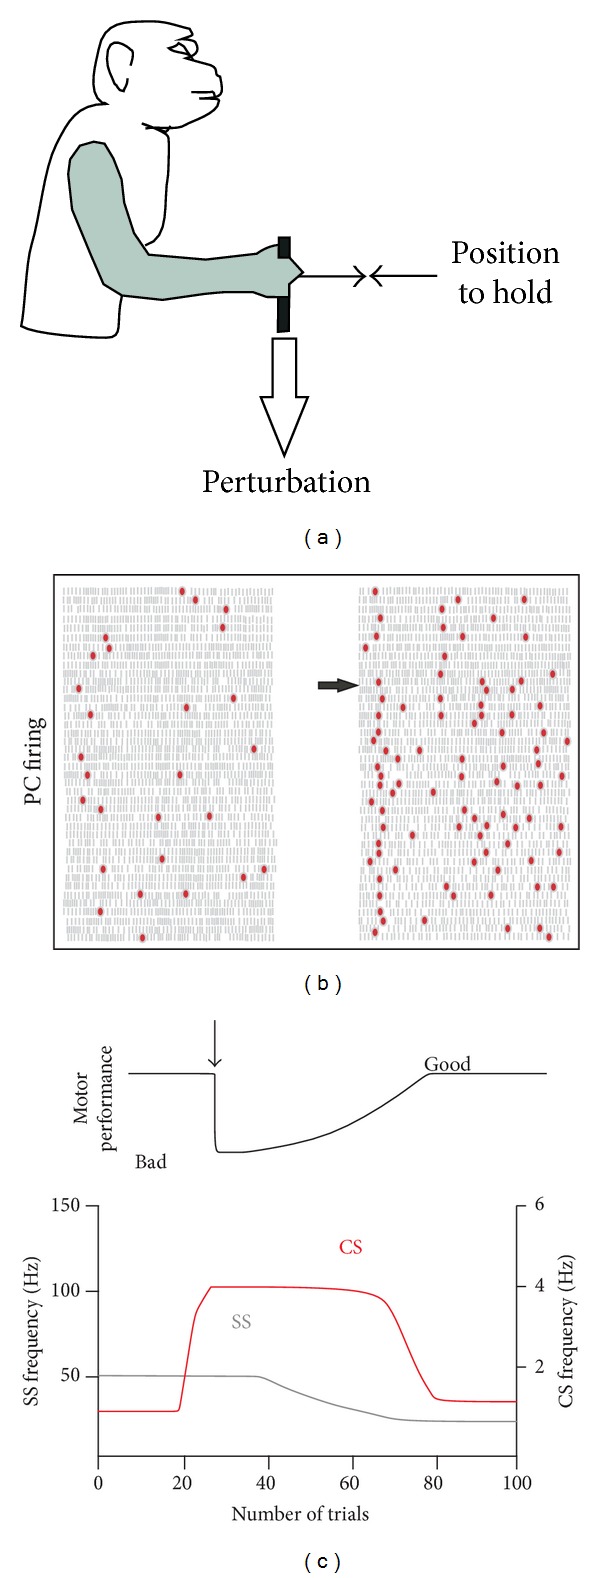
Figure 3.

Gilbert and Thach (1977) experiment in monkey. (a) Task consist to control a handle horizontally by flexing or extending the wrist to a central position and to hold it there despite flexor and extensor loads applied to the handle. (b) CS and SS frequencies change for a PC after a change in load (horizontal arrow). Each grey bar represents an SS and the red dots a CS. Each row of bars represents the discharge during a trial successively represented from top to bottom. Each flexor trace on the left, for which the monkey performance was good, is followed by an extensor trace on the right. At the arrow, the known extensor load of 300 g was modified to a novel 450 g inducing a strong decrease in the performance. (c) Idealized representation of the SS and CS firing a long time and the number of trials before load perturbation (vertical arrow), during the transition period from bad to good performance, and after. (Adapted from [36, 98] with permission).
