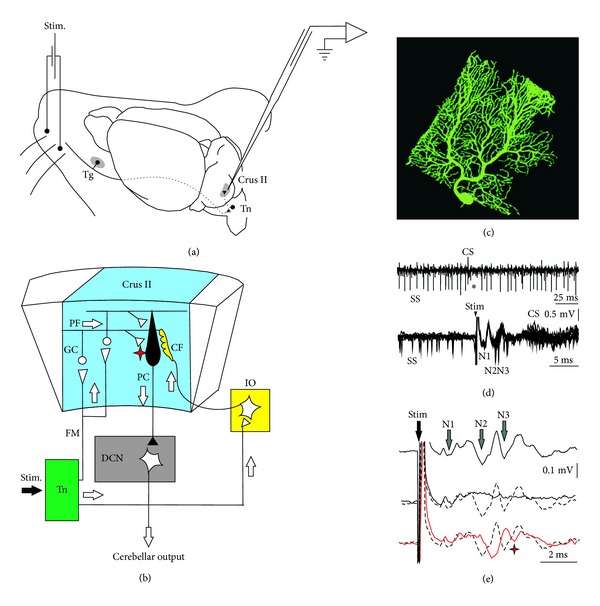
Figure 6.

Experimental design and electrophysiological response to electrical stimulation of mouse whiskers. (a) Animals were prepared for chronic recordings of local field potentials (LFP) and unitary extracellular activity in the Purkinje cell layer of the Crus I/II area. Facial dermatomes of the whisker region were electrically or tactilely stimulated with a pair of needles under the skin (Stim.) pulse, respectively. Sensory information comes into the Crus I/II area from the trigeminal nucleus (Tn) in the brainstem, which receives afferent signals from the trigeminal ganglion (Tg). (b) Schematic diagram of the circuits linking the trigeminal input and the olivo cerebellar system. (c) Photography of a single PC injected by Lucifer yellow. (d) Recording of spontaneous firing behavior of a Purkinje cell (PC) shows the presence of single spikes (SS) and complex spikes (CS). The presence of a CS followed by a pause in the SS firing (asterisk) identifies this neuron as a PC. Single trials, superimposed (n = 11), show spontaneous firing before the whisker electrical stimulation (Stim) and the temporal reorganization of the firing after the stimulus. SS firing occurred at the low points of the N2 and N3 components and later. The evoked CS occurred at a latency of 9–13 ms after the stimulus onset (arrowhead). (e) Long-term depression on the LFP is evident after the 8 Hz stimulation protocol (red line), when the latency of the N2 components increased and the amplitude of the N3 component strongly decreased. These effects were maximal just after the 8 Hz stimulation and persisted for at least 30 min. Single traces selected to compare latencies and amplitudes of LFP components; (top) before 8 Hz stimulation protocol, (middle) during 8 Hz stimulation, and (bottom) just after 8 Hz stimulation protocol. The red asterisk indicates the LTD effect on N3 postsynaptic components after 8 Hz stimulation, (adapted from [37] with permission).
