
Figure 1.
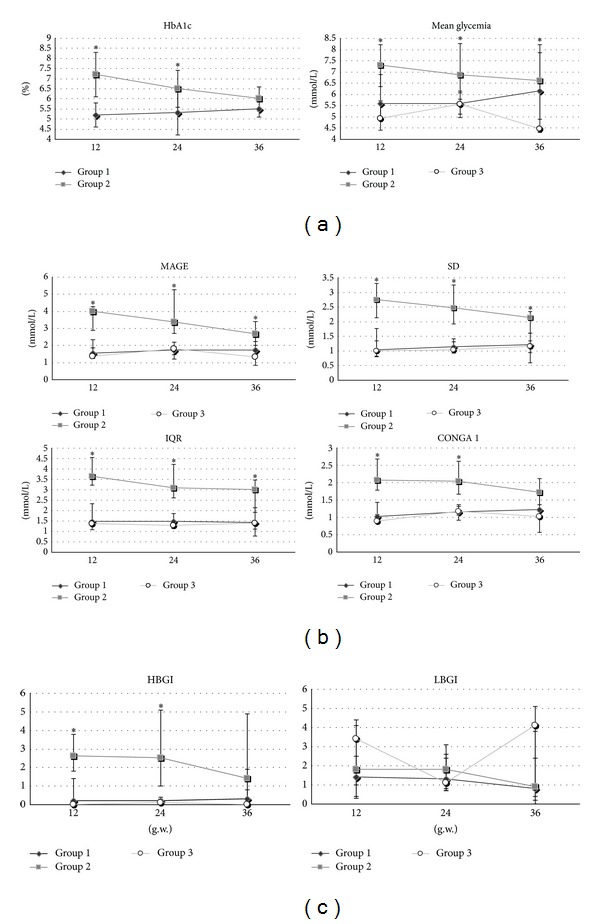
Trend in the three trimesters of pregnancy of indicators of average glycemic control (a), glucose variability (b) and hypohyperglycemic risk (c) in cases of gestational diabetes (Group 1), type 1 diabetes (Group 2) and healthy pregnant women (Group 3). MAGE, mean amplitude of glycemic excursions; SD, standard deviation; IQR, interquartile range; CONGA, continuous overlapping net glycemic action; HBGI, high blood glycemic index; LBGI, low blood glycemic index. Mean value, MAGE, SD, IQR, CONGA 1 are expressed in mg/dL; HbA1c expressed in %; LBGI and HBGI are expressed in classes of risk. *Statistical significance of ANOVA among groups considered for P < 0.05.