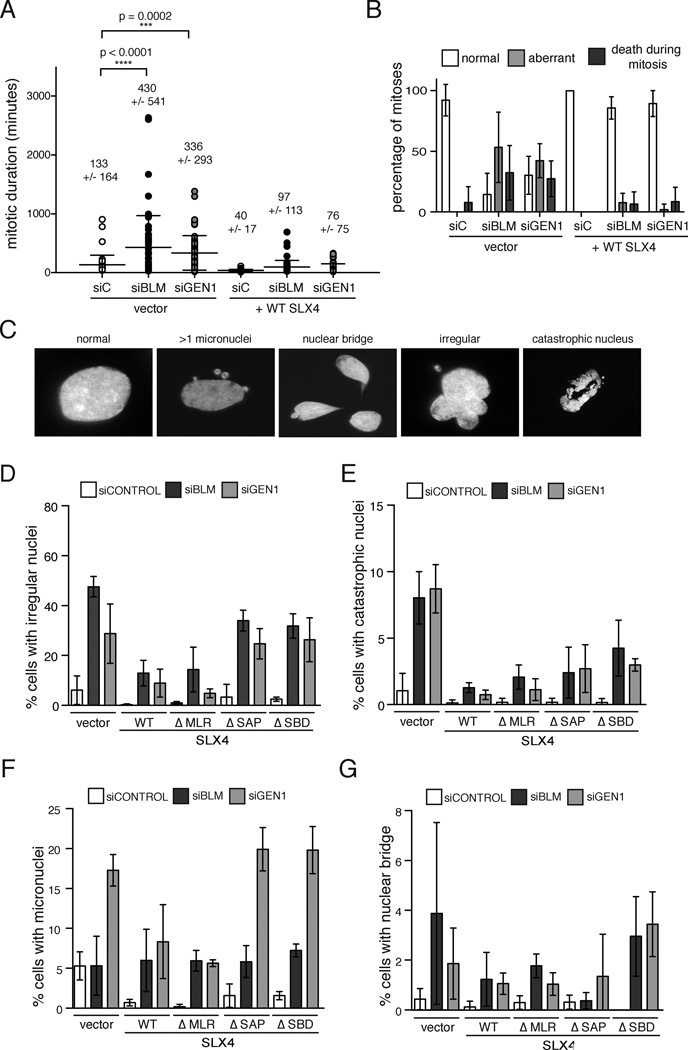
Figure 2. Mitotic duration is greatly increased and the majority of mitoses are abnormal in SLX4 deficient cells depleted of GEN1 or BLM.
(A). Duration of mitosis (in minutes) assessed by live-cell imaging of GFP-H2B-positive SLX4-null cells complemented with vector or WT SLX4 and also transfected with the indicated siRNAs. Each value plotted represents a single cell undergoing mitosis. Cells were scored from 5 independent movies for each experimental condition. p values were determined by one-way ANOVA. (B). Outcome of mitoses in the experiment described in (A). Cells entering mitosis and segregating to yield two daughter cells were scored as ‘normal’. Cells that failed to segregate or did so with lagging chromosomes or multiple daughters were scored as ‘aberrant’. Cells that died during mitosis or those with daughter cells that died during mitotic exit were scored as ‘death during mitosis’. Values plotted represent the mean percentages of scores from 5 independent movies for each experimental condition. Error bars represent the standard deviation between the 5 replicates. See also Table S1. (C). to (G). Nuclear morphology of SLX4-null cells depleted of GEN1 or BLM. SLX4-null and complemented cells transfected with indicated siRNAs were stained with DAPI 96 hrs post second siRNA transfection. Nuclear morphology was scored according to the example panel shown in (C). Cells with irregular nuclei (D), with catastrophic nuclei (E), with micronuclei (F), and with nuclear bridges (G) were counted. Note that cells that die during mitosis were not counted since they were not attached to a coverslip. Values plotted represent the mean percentage from three experimental replicates. Error bars represent the standard deviation of the replicate means. See also Figure S2.

