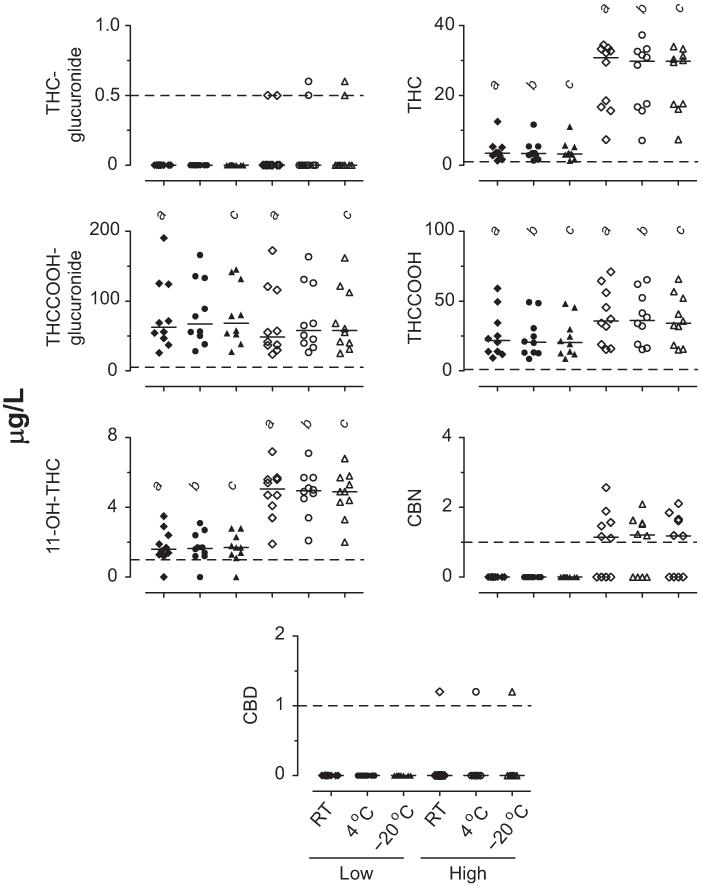
Fig. 1. Baseline concentrations in low and high THC blood pools prepared from samples collected after controlled cannabis smoking (n = 10 participant pools).
Horizontal short lines are medians, and dashed lines are LOQs. a,b,cSignificant differences between low and high pools at room temperature (RT), 4 °C, and −20 °C, respectively.

