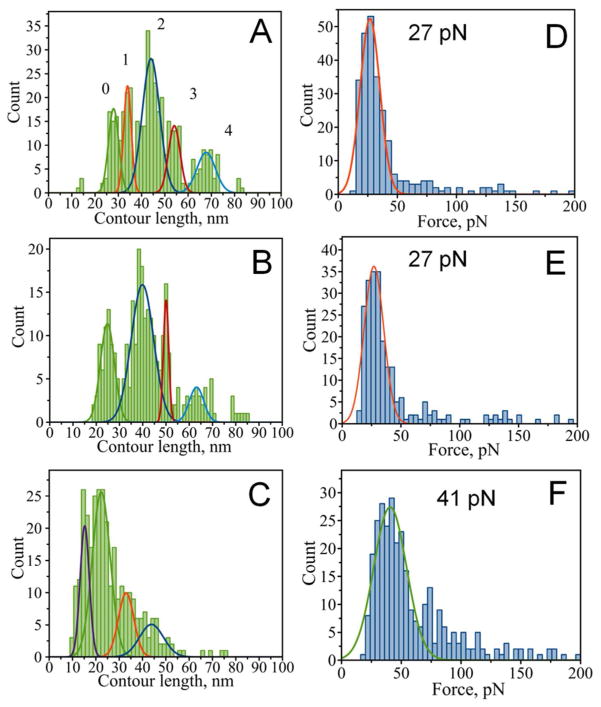
Figure 4.
Rupture contour length histograms (A,B,C) and rupture force histograms (D,E,F) for wild type α-Syn. A and D) single rupture event group (with contour length maxima at 28±2, 34±2, 44±4, 54±3 and 68±4 nm and a maximal rupture force of 27±8 pN), B and E) last events from multiple rupture group (with contour length maxima at 25±3, 40±5, 50±1 and 63±3 nm and a maximal rupture force of 27±8 pN), C and F) internal ruptures from multiple rupture group (with contour length maxima at 15±2, 23±4, 33±3, and 43±5 nm and a maximal rupture force of 41±14 pN).

