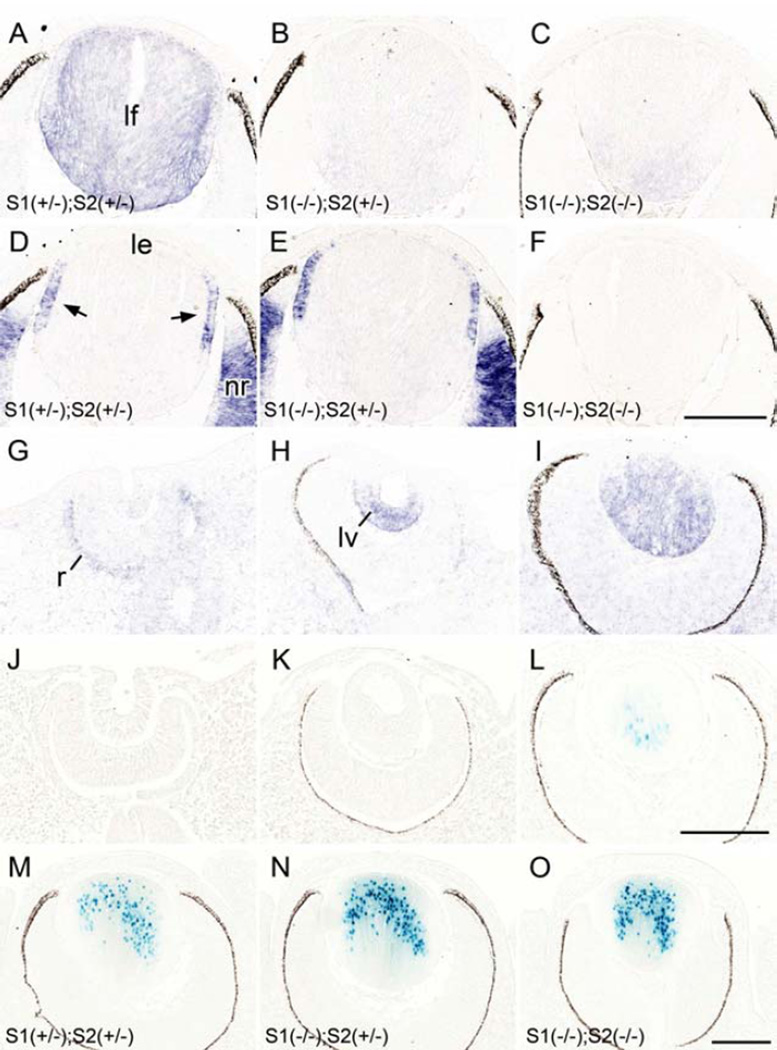
Fig. 1. Sfrp expression pattern in lens.
(A-I) In situ hybridization for Sfrp1 (A-C, G-I) and Sfrp2 (D-F) expression in the developing eye. Sfrp1 was consistently detected in lens fibers (lf) with slightly enhanced intensity in the cortical region (A). This signal was depleted from Sfrp1 KO samples (B, C). Sfrp2 was detected in the germinative zone (arrows) of the lens epithelium (le) and the neural retina (nr; D, E) and these signals were absent in the Sfrp2 KO sample (F). Note the sections A and D, B and E, and C and F, respectively were obtained from the same embryos (at E14.5). Sfrp1 was barely detected in the lens cells at lens pit stage (E10.5, G) whereas a weak signal was evident in the outer layer of the developing retina (r). By the time of lens pit/vesicle (lv) separation from the surface ectoderm a strong signal for Sfrp1 was detected in the posterior cells (at E11.5, H). After closure of the lens vesicle lumen Sfrp1 was detected mainly in the primary lens fibers (at E12.5, I). (J-O) The β-galactosidase derived from the Sfrp1 knock-in locus was monitored by X-gal staining. The nuclear-localisation signal conjugated to this enzyme resulted in blue stain development that was predominantly localized to the nucleus. (J, K) No X-gal staining was observed at E10.5 (J) and E11.5 (K) during lens pit and lens vesicle stages. (L) The first positive signal was detected at E12.5 in centrally located primary lens fibers. (M-O). Intensity of X-gal staining correlated with the copy number of the Sfrp1 knock-in allele; the lens with a single copy (i.e. heterozygote) showed weaker X-gal stain (M) compared to the lens with two copies of the Sfrp1 knock-in allele (i.e. homozygote, N). Removal of the Sfrp2 gene did not affect the intensity (or pattern) of X-gal staining because a similar intensity of X-gal staining was evident in Sfrp2 heterozygote (N) and Sfrp2 KO (O) lenses. Images shown were obtained from E14.5 embryos. Scale bars for A-F, G-L, M-O 200 µm.

